Use 'Print preview' to check the number of pages and printer settings.
Print functionality varies between browsers.
Printable page generated Saturday, 20 June 2026, 1:30 AM
Chapter 2 Water use in different sectors
2.1 Introduction
Myanmar is an agro-economy with agricultural usage placing the greatest demand on the country’s water resources. However, water demand for domestic and industrial use is growing fast, as agriculture’s contribution to the economy declines, and the contribution from industry and services grows.
This chapter looks at these changes, what is driving them and what they mean for the country’s development and future use of water. In order to understand these developments better, global water use is considered first, followed by regional trends in water use, before shining the spotlight on Myanmar in order to understand what is happening in the country better.
2.2 Water use globally
Over the past century, water use across the planet has increased nearly eight times. The reasons for this are a blend of population growth, economic development, and changing consumption patterns. These reasons are likely to continue, and therefore water use is likely to continue to grow.
This steady rise in water use has principally been led by surging demand in developing countries and emerging economies, although per capita water use in most of these countries still remains far below per capita water use in developed countries. Agricultural uses, including irrigation, livestock and aquaculture are by far the largest water consumers, accounting for 69% of annual water withdrawal globally. Industry and power generation account for 19% and household use for 12% (FAO, n.d.).
Global water needs are expected to continue to gradually grow at a similar rate until 2050, accounting for an increase of 20–30% above the level of water use in 2019 (UN, 2019). Although there are variations in projections, the analysis suggests much of the growth will be attributed to an increase in demand by the industrial and domestic sectors.
Agriculture’s share of total water use seems likely to decline in comparison with other sectors, but it will remain the largest user in terms of both water withdrawal and water consumption in the near future, as shown in the following diagram (UN, 2019).
Question 1
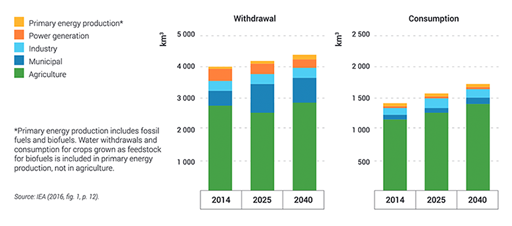
Study the statistics in the figure above and answer the following questions.
In 2017, 5.3 billion people (71% of the global population) used a safely managed drinking water service, which means one located on premises, available when needed and free from contamination. As many as 785 million people lack even a basic drinking water service, including 144 million people who are dependent on surface water. Globally, at least 2 billion people use a drinking water source contaminated with faeces (WHO, 2019).
According to the world health organization, approximately 50 litres of water per person per day are needed to ensure the most basic needs are met while keeping public health risks at a low level. However, these amounts are indicative as they might depend on particular contexts and some individuals and groups require additional water due to health, climate and working conditions.
Question 2
Whilst 50 litres per person per day ensures that basic needs are met, some household uses require a lot of water.
Use the boxes below to list all the household uses you can think of that use a lot of water. Can you fill every box?
Answer
Some possibilities you may have thought of together with their water usage are:
- Flushing a toilet uses 10 litres per flush
- Washing machine uses 40–80 litres per wash
- Bath uses 150–300 litres
- Shower uses 50–100 litres
- Washing dishes by hand uses 23 litres
- Leaving the tap running for 1.5 minutes while you brush your teeth uses 18 litres
- Washing a car with a hose uses 200–500 litres.
(Source: Moral, 2015.)
2.3 Water resources and uses in Asia
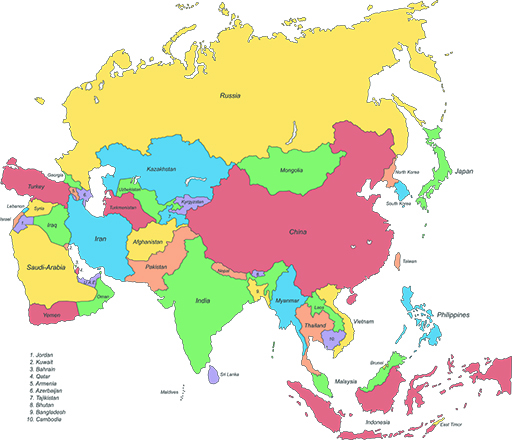
Looking at the regional context, Asia is the largest continent in the world in terms of both area (43.5 million km2) and population (3.5 billion). Travelling clockwise, it borders the Arctic Ocean in the north, the Pacific Ocean in the east, the Indian Ocean in the south, and the Mediterranean Sea in the west.
Asia is notable for high population densities and large settlements, with five of the eight most populous countries in the world, namely China, India, Indonesia, Pakistan and Bangladesh located in Asia (UN DESA, 2015). Asia is also characterised by extremely diverse climatic zones, ranging from arctic conditions in Siberia in the north to tropical ones in Southeast Asia and Southern India.
The distribution of precipitation in the Asia region is extremely varied both geographically and seasonally. Precipitation is abundant on the southern slopes of the Himalayas, the western slopes of the mountains of India and Indochina and the islands of Indonesia, all of which receive from 1,500 mm to in excess of 3,000 mm of rain annually. Annual rainfall near the equator zone is more than 2000 mm, per year. By contrast, almost the entire north-western part of the region is extremely dry, with an annual precipitation of less than 200 mm, and many parts of Southwest and Central Asia have precipitation rates of less than 150 mm per year (Zaisheng et al., 2013).
In the countries bordering the Indian and Pacific Oceans, cyclical monsoon rainfall provides distinctive dry and wet seasons – during the long dry season, temporary water shortages are experienced in many river basins, whilst the wet season is often accompanied by flooding. In absolute terms, the annual renewable water resources are considerable in many developing countries of the region, although not all of this is available for exploitation.
Groundwater resources play an important role in sustaining water needs in Asia. Groundwater is used for crop irrigation, food production, industry, and domestic use, and accounts for about 25% of total water usage in Asia (FAO, 2016). Indeed, the groundwater withdrawal amount in Asia accounts for the majority (72%) of global usage value. This is because Asia has intensive agricultural activities and a large population with high population growth rates (FAO, 2016; Gleeson et al., 2012; Shah, 2005).
Eight out of the ten countries with the largest groundwater extraction are located in Asia – India, China, Nepal, Bangladesh and Pakistan alone account for nearly half of the world’s total groundwater use because of their large populations and intensive agricultural activities. Several countries in Western Asia with no permanent rivers or lakes (Saudi Arabia, United Arab Emirates, Oman, Kuwait, Bahrain, and Qatar) rely on groundwater for almost 100% of their renewable water source.
Groundwater extraction has increased greatly in Asia, particularly since the 1970s. Global estimates on the sustainability of groundwater usage strongly indicate that current groundwater consumption for some regions in Asia, such as the upper Ganges River Basin or North China Plain, is likely to face serious aquifer depletion and water shortage problems (Gleeson et al., 2012).
Groundwater also provides a valuable base flow, supplying water to rivers, lakes, and wetlands, which are distinct ecosystems that are flooded by water, either permanently or seasonally.
Apart from its ecological function, groundwater has significant socio-economic implications. For instance, it was estimated that groundwater irrigation in Asia contributes between US$10 billion and US$30 billion per year to its economy (Shah et al., 2003; WWAP, 2015).
Question 3
a.
Fossil
b.
Rain
c.
Salt
d.
Surface
The correct answer is d.
The social and economic benefits of groundwater are of particular importance to the agricultural activities of Asia. Agriculture is the key to general economic development in many Asian developing countries, providing food security and alleviating poverty. Global estimates suggest that irrigated agriculture accounts for approximately 79% of the total water withdrawals in Asia, which is higher than the global average of 70% (FAO, 2016; WWAP, 2016).
Water use for irrigation activity is also inextricably linked to job creation. Employment rates in the agricultural sector are 39% in Southeast Asia and 44.5% in South and Southwest Asia (ILO, 2014; WWAP 2016). In India, it has been estimated that more than half of the total workforce remains in the agricultural sector (Chand and Parappurathu, 2012).
Some evidence suggests that a causal link exists between the value of economic activity and groundwater abstraction in the major cities of Asia. Consequently, groundwater aids urban growth and its rapid economic development (IGES, 2007).
2.4 Myanmar’s water uses
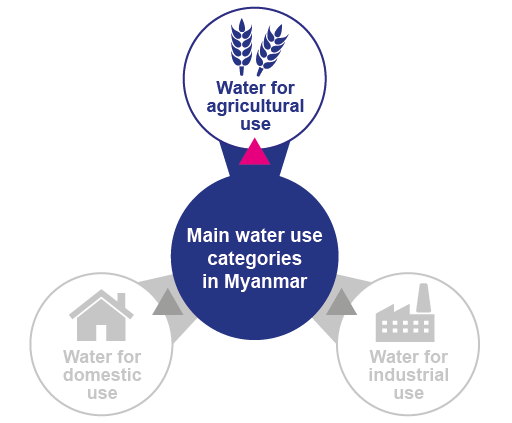
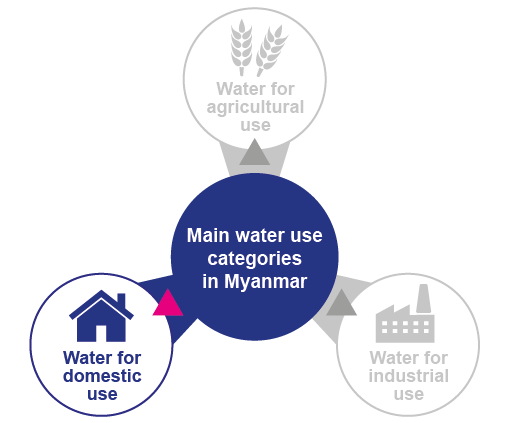
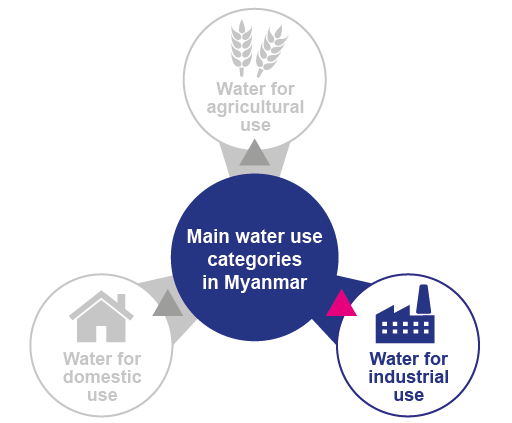
Myanmar currently uses less than 5% of the renewable water resource available to it. Of the water it withdraws, around 89% is for agriculture, 10% for municipalities, and 1% for industry (ADB, 2013). This is a higher agricultural average than for Asia as a whole, reflecting the lower level of industrialisation and urbanization in Myanmar. Approximately 91% of Myanmar’s total water withdrawal comes from surface water, and 9% from groundwater (ADB, 2017).
Again, Myanmar does not follow the trend in Asia, where countries rely heavily on ground water extraction. This is because Myanmar has abundant surface water resources. There are three main water use categories in Myanmar.
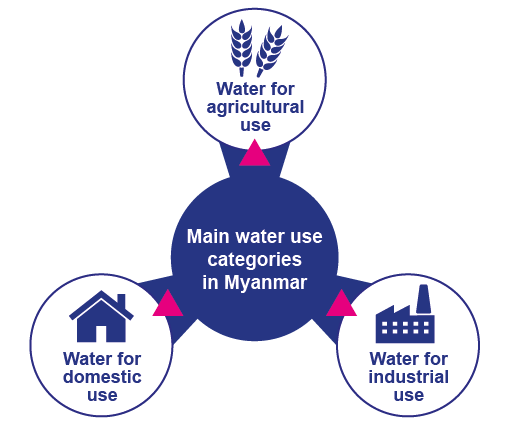
You will explore each of these three main water uses in the next three sections.
2.5 Water for agricultural use
Myanmar is largely an agricultural economy with society and agriculture relying heavily on precipitation. Too much rainfall causes floods and too little rain causes droughts, both of which have a negative impact on agricultural production. Decreased income from the agricultural sector can have many adverse effects on the income of individual farmers as well as the country’s economy.
The Government of Myanmar has largely focused on rural development as the engine of economic growth in the country. This is because over two-thirds of the population live in rural areas and agriculture accounts for 60–70% of employment, largely through subsistence farming. This is much higher than for the average across Asia (ADB, 2017). However, the contribution of agriculture to gross domestic product (GDP) is only 26.7%, down from 57% in 2001, with industry now contributing 34.5% and services 38.7% (ADB, 2017).
Gross domestic product
Gross domestic product (GDP) measures the value of economic activity within a country. GDP is the sum of the market values, or prices, of all final goods and services produced in a country during a given period of time. GDP provides an economic snapshot of a country, used to estimate the size of an economy and its growth rate. It is a powerful number as the success of government policy is evaluated on this measure more than any other.
Question 4
Despite 60–70% of people in Myanmar working in agriculture, it contributes only 26.7% to the GDP of the country. What reasons might explain this?
Answer
Reasons could include agriculture being inefficient, low use of farming technology, growing low value crops, high value industrial enterprises and services that are not labour intensive.
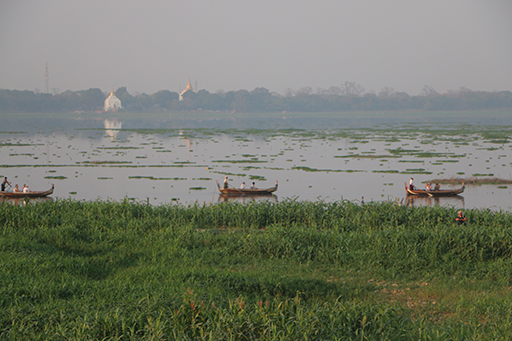
Rice is the main crop and staple food. Other crops include pulses, wheat, cotton and sugarcane. A total area of 18,400 km2 is irrigated in Myanmar, with potential for further expansion lying mainly in upper Myanmar, in the Chin, Kachin and Shan states (FAO, 2011). More than half of the Ayeyarwady delta region, where agriculture is concentrated, is cultivated with rain-fed rice. In the dry season, rice is mostly cultivated in Lower Myanmar using irrigation.
Irrigation is supplied through water diversion with canals, weirs, dams and tanks, and in recent years with substantial development of an infrastructure of water pumps and tube wells. The seasonal rainfall pattern, and its accompanying river flows, largely determines the annual irrigation budget as does the crop water requirement.
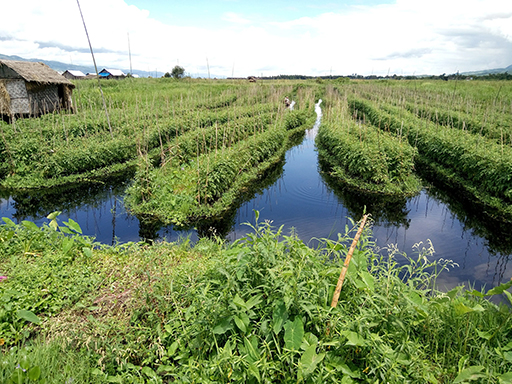
In 2017, aquaculture supplied 20% of domestic fish consumption in Myanmar. From 2007–17, fish production in the Ayeyarwady Delta is estimated to have increased by 250%, and the area of ponds in this region, which accounts for 90% of Myanmar's farmed fish, is estimated to have doubled (Beijnen, 2018). Shrimp farming is particularly popular in the delta region.
2.6 Water for domestic use – drinking, preparing food and washing
Access to safe drinking water and managed sanitation systems that accords with WHO standards is a challenge across the country. Access to a piped supply of safe drinking water is not equally accessible, and even in places with a piped system, water is not necessarily of drinking quality. The goal is to supply more drinking water through a piped water system but, currently, rainwater harvesting, and deep tube wells are the major sources for drinking water, even in some urban areas.
The 2014 census reveals that only 69.5% of households have access to improved sources of drinking water. Of these, 87% were urban households, while just 62.7% of rural households had access to improved sources of drinking water. This level of supply of improved sources is significantly below the aggregate levels reached in Southeast Asia as a region, where 90% of all households had access to improved sources of drinking water in 2015 (Government of Myanmar, 2017).
The majority of Myanmar’s population obtain drinking water from groundwater sources rather than surface water, which has cut the number of diarrheal and other disease infections. Storage of water in reservoirs, community ponds, and large drums for the collection of rainwater for domestic and drinking water is also common in rural area.
Domestic use of water in Myanmar is the second largest use after agriculture, and includes sanitation, cooking, as well as drinking water. Groundwater is also mostly used for domestic purposes.
In rural areas, it is predominantly women and girls who are responsible for collecting water for domestic use. Over half of rural households use either tube wells, protected wells, or springs (ADB, 2017). The physical carrying capacity of women and girls limits the amount of water used domestically in rural households.
In Mandalay and Yangon, only a small percentage of the population receives water that has been treated and only at certain times of the day, whilst in other parts of the country, the supplied water is untreated. This means that many urban dwellers rely on bottled water.
For example, there are three main sources of water supply in Yangon city, the most populous city in the country. These are Gyo Phyu, Phoo Gyi and Nga Moe Yeik water reservoirs, providing over 7.6 million litres of water every day. However, about half of the water supply is wasted due to water losses and leakage in the supply system.
Yangon City Development Committee (YCDC) has been facing difficulties managing water wastage and lacks the resources required to prevent illegal tapping of water from the city’s pipelines, which is then repackaged and sold for higher prices in various municipalities, resulting in losses for the city. Currently, water prices charged do not cover production costs, with the government subsidizing the balance for the benefit of the public. As such, the city has opted to allow private companies to manage the supply and distribution of water. Over 30 local and foreign companies are seeking to invest in the city's water distribution project.
The construction of pipelines is underway from the Lagwunpyin water storage facility to Thakayta and Dawbon townships in Yangon Region. The project is expected to distribute 11.3 million litres of water each day on completion. Pipelines are being laid along Shukinthar Road and Ayeyawun Road.
A project worker on the section of new pipeline in Shukinthar Road, which will help to distribute more water to the public, said, “We are prioritizing on connecting the bigger pipelines as the smaller pipes can be joined more easily” (Global New Light of Myanmar, 2019).
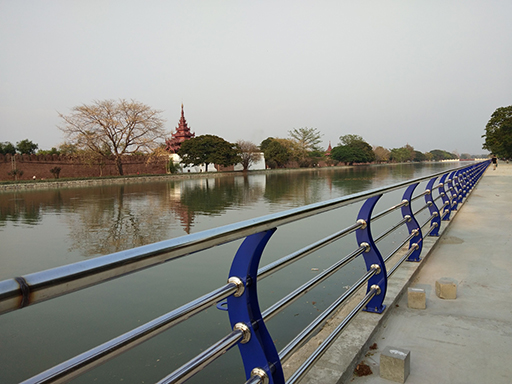
The main source of water supply for Mandalay City and small towns in the surrounding region is from the Ayeyarwady River and Sedawgyi Dam. Water Supply in Mandalay comes from three systems:
- Moat water supply system
- Tube well (artesian well) water supply
- Other water supply system.
A moat was traditionally a body of water around a palace or town to keep people out, a defensive measure. Moats are deep, wide ditches filled with water. They were usually built near sources of water that flowed into the moats. Today they act as additional water resources for distribution into canals and wells, which is how the moat is used in Mandalay city.
In a tube well system, the tube wells are drilled into the bank of the river. The average tube well is about 40cm in diameter and about 150m in depth. The production of water from each tube well is about 190,000 litres per hour and there are a total of 17,867 tube wells in Mandalay City.
The other water supply systems supplying Mandalay are canals like the Yaynimyaung canal, and creeks, such as the Payandaw creek, as well as private wells.
Rising urbanization is likely to increase water demand in Myanmar’s towns and cities. The 2014 census revealed that fewer than 30% of the population live in urban areas, or nearly 15 million people, up from 24% from the previous census in 1983 when 8.5 million people lived in urban areas. However, this level of urbanization is one of the lowest in Southeast Asia, less than Vietnam (34%), and much lower than in Malaysia (74%) (ADB, 2017).
Population increase will also lead to greater household water demand, but again the increase is slow. In 2014, Myanmar’s population was 51.5 million, up from 35.3 million in 1983. Recent analysis by the Ministry of Immigration and Population suggests that the population has grown by less than 1% per year since 2010 (ADB, 2017).
As for sanitation, about three quarters of all households had access to improved sanitation, which is in line with regional levels. In urban areas 92% of households enjoyed improved sanitation, compared to 67% in rural households. A nationwide overhaul of the sanitation system is necessary to ensure safe public health conditions (Government of Myanmar, 2017).
Question 5
| Water Supply % | Sanitation % | |||||
| Year | Urban | Rural | Total | Urban | Rural | Total |
| 1990 | 80 | 48 | 56 | --- | --- | --- |
| 2000 | 85 | 60 | 67 | 79 | 56 | 62 |
| 2014 | 87 | 66 | 70 | 92 | 67 | 74 |
Study the table above and answer the following questions.
a.
Between 1990-2000
b.
Between 2000-2014
The correct answer is a.
a.
Between 1900-2000
b.
Between 2000-2014
The correct answer is a.
a.
Rural
b.
Urban
The correct answer is b.
2.7 Water for industrial use
Industry contributes 34.5% to GDP. Principal uses of water in industries are for processing, product treatment, cleaning, and cooling. Large water intensive industries are sugar mills, paper mills and cement industries. On average, ground water supplies 22% of the total industrial water use in Myanmar (Pavelic. et al., 2015).
But an impediment to industrial growth has been access to electricity, as Myanmar has some of the world’s lowest electrification and electricity usage rates. Industry is forced to rely on expensive back-up generators, despite Myanmar having abundant electricity-generating resources in the form of hydropower, new gas fields and large renewable sites (solar and wind).
Infrastructure development is necessary for these resources to be harnessed to meet the growing demand for electricity in the country. The two most important industries using water in Myanmar are hydropower production and mining, with other industry use being small by comparison, but growing.
Hydropower is energy that can be harnessed from a continuous flow of water, such as a river. It is a renewable source of energy because the water cycle is constantly renewed by the sun. Modern hydropower plants produce electricity using turbines which spin with the moving water. They are connected to a generator where the energy is stored as electricity.
Myanmar has been accelerating its hydropower development. Generating hydroelectric power enhances foreign exchange earnings through exports and regional cooperation as well (UNDP, 2013). Myanmar has the potential to be an energy bridge between South Asia and Southeast Asian energy systems, due to its convenient location between these geographical and political regions (World Bank 2007).
Hydropower also offers a renewable source to meet the country’s growing domestic electricity needs.
In 2014, hydropower comprised two-thirds of Myanmar’s different energy sources to meet its energy consumption needs, known as its energy mix, with 3,151 MW of installed capacity from 25 operational projects. Myanmar has the potential for more than 100 GW of hydropower, of which only 3 GW has been developed so far (IHA, 2015). Another 46 GW of technically feasible potential has been identified, and a number of these projects, mostly hydropower dams, are now under construction or at an advanced planning stage commissioned by the Ministry of Electricity and Energy working with Western developers (IHA, 2015). The largest potential is to be found in the Kayin, Shan, and Kayah states, where the Salween River is the major hydropower resource (IHA, 2015).
Myanmar’s electrification rate is only 35% of the country and energy needs are growing rapidly. In 2013, Myanmar’s per-head electricity consumption was 156 kWh, which compares poorly with other Southeast Asian countries, such as Laos (506 kWh), Vietnam (1,285 kWh) and Thailand (2,426 kWh). Regular power cuts also suggest that demand is a long way from being satisfied.
Hydropower measurement
These are the orders of magnitude of energy, k is kilo, M is mega, G is Giga and T is Tera.
- 1 kiloWatt KW - 1000 Wh
- 1 megaWatt MW - 1,000,000 Wh
- 1 gigaWatt GW - 1,000,000,000 Wh
Mining is also a major user of water resources for mineral extraction, as well as milling of mined materials, and injection of water for secondary oil recovery or for unconventional oil and gas recovery, such as hydraulic fracturing.
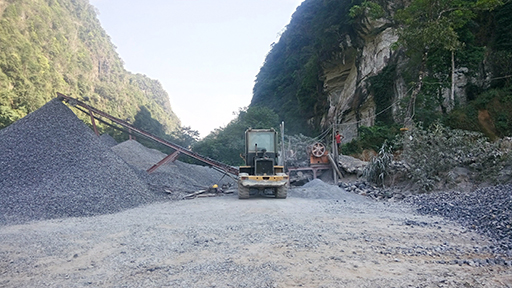
Myanmar is richly endowed with mineral resources including copper, gold, lead, zinc, silver, tin and nickel. It also has extensive gemstone deposits, and oil and natural gas fields. Many areas of the country are yet to be explored for their mineral wealth. In 2017–18, mining contributed under 5% to the country’s GDP, although it accounted for 20% of the country’ revenue from exports (EITI, 2018). However, whilst mining is an important foreign exchange earner, it is not a big employer, with only 0.3% of the workforce working in an extractive industry (EITI, 2018).
2.8 Using water resources to enhance Myanmar’s development
Water is essential for socio-economic development and for the maintenance of healthy ecosystems. If it is efficiently managed, it can be a driver for growth and poverty reduction. The lack of access to a reliable water source and the variability in yield and quality are constraints on livelihood and agricultural development in Myanmar. The hydropower potential could be harnessed to provide much needed electricity for the growing sectors of industry and services.
Myanmar’s rivers are the main transport channels, providing corridors for travel around the country and facilitating the movement of large volumes of agricultural produce, minerals, forest products and manufactured goods to the country’s population centres and ports (Government of Myanmar, 2017).
To harness Myanmar’s water resources to the engine of economic growth, both structural measures and non-structural measures are needed. Structural measures include the building of dams, canals or treatment plants, networks of irrigation piping systems, and improvement of river water depths for navigability, transport, and river ports.
Non-structural measures include institutional reforms, development of water standards, the provision of modern hydrographic and navigational information systems to reduce risks for shipping and improve navigation, and a national water law. Both measures are necessary to contribute to economic growth, job creation and development generation in Myanmar.
2.9 Conclusion
In this second chapter, you have learned about:
- How water is used globally
- Water usage in Asia
- How Myanmar uses its water resources.
Myanmar is unlike many countries in Asia in having abundant water resources, although there are challenges regarding where the water is in relation to where most people live and work in the country.
You have discovered that water has the potential to be used more effectively to drive the economy, providing electricity to fuel industry and services, and to improve agricultural production.
However, you have also learned that structural and non-structural measures need to be in place for this to happen.
In Chapter 3, you learn that there is also a problem with the quality of water in Myanmar.