Use 'Print preview' to check the number of pages and printer settings.
Print functionality varies between browsers.
Printable page generated Monday, 6 May 2024, 10:43 PM
Fundamentals of data for AMR
Introduction
This module introduces the basic concepts, definitions and sources of data related to antimicrobial resistance. It reviews why we need to collect, analyse and report on AMR data, as well as data on antimicrobial use (AMU) and antimicrobial consumption (AMC). The distinction between these is subtle: AMU refers to the quantity of antimicrobial drugs prescribed or administered to an individual person or animal, or group of animals (e.g., herd, flock), and may include information on how antimicrobials are used (e.g. for prophylaxis or the treatment of specific conditions), whereas AMC refers to the total quantity of antimicrobial drugs imported, manufactured and/or sold in a country or region. AMC is sometimes used as a proxy for AMU when detailed data on actual use is not available.
As part of this module you will have the opportunity to reflect on sources of AMR-related data in your own workplace and how they fit into local, national and global systems to collect, collate, analyse and use AMR-related data to inform decision-making. The module also explains standard measurement units for AMR, AMU and AMC. Finally, you will be introduced to important concepts related to error and bias, and how they affect the interpretation and use of AMR, AMU and AMC data.
This is the first in a series of modules related to AMR data. Some of the topics introduced in this module will be expanded on in modules on Sampling, Processing and analysing AMR data, Summarising and presenting AMR data, and Legal and ethical considerations in AMR data.
After completing this module, you will be able to:
- explain why it is important to measure AMR, AMU and AMC data
- identify different types of AMR, AMU and AMC data
- explain how data become useful and lead to informed decision-making in the AMR response
- identify and explain potential sources of error and bias that affect the quality and reliability of AMR, AMU and AMC data.
Activity 1: Assessing your skills and knowledge
Before you begin this module, you should take a moment to think about the learning outcomes and how confident you feel about your knowledge and skills in these areas. Do not worry if you do not feel very confident in some skills – they may be areas that you are hoping to develop by studying these modules.
Now use the interactive tool to rate your confidence in these areas using the following scale:
- 5 Very confident
- 4 Confident
- 3 Neither confident nor not confident
- 2 Not very confident
- 1 Not at all confident
This is for you to reflect on your own knowledge and skills you already have.
1 Why do we need data on AMR, AMU and AMC?
1.1 Purpose of measuring AMR, AMU and AMC
In previous modules you learned what AMR is and why it is a problem. The scale of the problem of AMR is often expressed in statements such as:
Globally, an estimated 214 000 newborns die from blood infections (sepsis) caused by resistant pathogens each year – representing at least 30% of all neonatal sepsis deaths.
This statement, and others like it, include
Why might we also want data on AMU and AMC? You have learned previously about the relationship between AMU and AMC, and the emergence and spread of AMR (see Table 1 for refresher definitions of AMR, AMU and AMC).
| Term | Definition |
|---|---|
| Antimicrobials | Medicines used to prevent and treat infections caused by micro-organisms in humans, animals and plants. As noted in earlier modules, we will usually use the term ‘antimicrobial’ to mean antibacterial drugs. |
| Antimicrobial resistance (AMR) | Occurs when bacteria change over time. The changed bacteria are no longer killed by medicines that were once effective, making infections harder to treat and increasing the risk of disease spread, severe illness and death. AMR also occurs naturally, but is more important when it is a result of AMU, especially inappropriate and excessive use. AMR can increase due to a range of factors that increase the risk of spread of bacterial infections, such as poor infection prevention and control in healthcare settings, lack of access to water, poor sanitation and hygiene facilities, poor nutrition and other factors. As above, AMR refers to resistance in all types of infection (bacterial, viral, fungal, etc.) but this module focuses predominantly on bacterial AMR. |
| Antimicrobial use (AMU) | Estimates of the actual quantity of antimicrobial medicines administered to people or animals. |
| Antimicrobial consumption (AMC) | Estimates of the amount of antimicrobial medicines that are imported, manufactured, distributed or sold for use in human or animal medicine. AMC may be used as a proxy for AMU. |
In general, there are two broad objectives of measuring AMR, AMU and AMC:
- To detect and characterise the problem of AMR – including the scale of the problem, who is affected and in which contexts AMR occurs.
- To guide how and where to develop interventions to reduce the risk of AMR (such as specific programmes to reduce inappropriate AMU) and to evaluate whether they are effective.
If the scale and location of a problem is unknown it is difficult to allocate resources effectively. For this reason, global efforts are underway to measure AMR, AMU and AMC. Measuring and monitoring AMR, AMU and AMC is an important step towards effective interventions to slow the global acceleration of AMR.
In public and animal health surveillance programs, it is particularly important to prioritise the generation of data on aspects of AMR that can actually be targeted by interventions. For example, we might want to measure AMU in a hospital before designing an
1.2 A recap of the basics of surveillance systems
If you have previously completed modules An introduction to AMR surveillance, Introducing AMR surveillance systems, AMR surveillance in animals and/or An overview of national surveillance systems, you will have learned about the purpose of public health surveillance, which is the ‘ongoing, systematic collection, analysis, and interpretation of health-related data essential to planning, implementation, and evaluation of public health practice, closely integrated with the timely dissemination of these data to relevant public health stakeholders to inform action at a local, national or global level’ (WHO, n.d. 4).
Strengthened AMR surveillance systems across human and animal health is one of the five strategic priorities of the WHO’s Global Action Plan (GAP) on AMR. Initiatives to strengthen AMR surveillance around the world include PAHO’s GLASS (Global Antimicrobial Resistance Surveillance System), ReLAVRA (Latin American Network for Antimicrobial Resistance Surveillance) and the ECDC’s EARS-Net (European Antimicrobial Resistance Surveillance Network). Each of these systems collates national-level data on AMR to understand regional or global scale trends. These systems also support countries to strengthen their national surveillance systems, including improving data quality and implementing standardised measurements. This means measurements can be compared directly across settings and over time. More information about these systems is available in the module Introducing AMR surveillance systems.
2 Data and information
2.1 Basic definitions
By this stage, you are starting to appreciate the fundamental importance of data in understanding and responding to AMR as a global health challenge. We will now introduce some important concepts that you can use to describe what data are, what forms data might take, and how data are organised. You will have an opportunity to reflect on and apply these concepts later in the module.
2.1.1 What are data?
‘Data’ refers to any observation or set of observations or measurements that represent attributes about an entity, also referred to as a
You may be most familiar with the idea of ‘data’ being represented in numbers, but data can be expressed in many different ways, such as characters, words, images, and even sounds and videos. For example, the class of antibiotics known as ‘cephalosporins’ can be represented as a word written into a hospital record (‘cephalosporin’), as a set of characters (the
In the case of AMR/AMU data, the entity or data unit can be an individual person or animal, a bacterial pathogen, a health facility or farm, or a country, depending on the purpose of data measurement.
Activity 2: Identifying data
2.1.2 Variables
A
Activity 3: Common variables for characterising data units
In your workplace, what data units are most often used and what are some of the common variables that might be relevant for characterising these units?
Some variables can be observed or recorded directly – for example, the body temperature of a person or animal can be observed by reading the result on the thermometer, providing it is working and used correctly. Other variables are defined by applying rules or calculations to directly observed variables. For example, the variable ‘fever’ might be based on a binary classification of body temperature, with any patients recording a body temperature higher than 37.5°C classified as having a fever, while those with a body temperature of 37.5°C or less classified as ‘no fever’. Similarly, ‘age in years’ can be recorded directly or calculated from the documented date of birth.
Variables can be further classified into
Consider once more the example of body temperature. Imagine that you measure the body temperature of five patients using a standard thermometer, with the results shown in Table 2.
| Patient number | Body temperature |
|---|---|
| 1 | 36.6°C |
| 2 | 41.2°C |
| 3 | 37.6°C |
| 4 | 37.4°C |
| 5 | 20.5°C |
Now imagine that you have data for the same patients, but this time the data is represented using the variable ‘Fever’, which has two categories, ‘Yes’ and ‘No’. Their body temperatures are shown again in Table 3. A cut-off value of 37.5°C or above is used to determine whether the patient has a fever.
| Patient number | Body temperature | Fever |
|---|---|---|
| 1 | 36.6°C | No |
| 2 | 41.2°C | Yes |
| 3 | 37.6°C | Yes |
| 4 | 37.4°C | No |
| 5 | 20.5°C | No |
Activity 4: Different types of information implied by ‘body temperature’ and ‘fever’ variables
What do you notice about these two variables, ‘body temperature’ and ‘fever’? What different types of information are implied by each variable?
Discussion
‘Body temperature’ is an example of a numeric (quantitative) variable, whereas ‘fever’ is an example of a categorical (qualitative) variable. In general, there is more information available when the data are presented as numeric variables. In this example, we can see that patient 2 has a very high body temperature, which might indicate a life-threatening infection. We can also see that patients 3 and 4 have a mildly elevated temperature and their values are very similar (only 0.2°C difference). However, when the cut-off is applied, only patient 3 is classified as having ‘fever’. Finally, we observe that the body temperature of patient 5 is implausibly low, and is therefore likely to be an error (the thermometer might be broken or the user might not have read it properly – or possibly, the patient might be dead!) We would not detect this problem if we only had access to the variable ‘fever’, as this patient is simply categorised as having no fever. In fact, we would normally remove this observation from our analysis as it is a clear error.
Despite containing less information overall, categorical variables are still very useful. For example, it is both simpler and more clinically meaningful to describe the proportion of hospitalised patients with blood infections who have fever, than describing their average body temperature. Using categorical variables also means that comparisons can be made between groups, for example comparing outcomes for patients classified as having a fever versus patients with ‘no fever’. There is more detail on how to describe and summarise different types of data in the Processing and analysing AMR data module.
By now you can probably infer some of the key differences between numeric and categorical variables.
- data are represented as counts or measurements
- data are represented using numeric values as integers (1, 2, 3), fractions (½, ¼) decimals (37.7, 39.134) or percentages (20%, 50%)
- include age, height, blood pressure and minimum inhibitory concentration.
- data are represented as belonging to a particular group (a ‘category’)
- can be represented by a name, a string of alphanumeric characters, or numeric values
- include sex/gender, occupation and antimicrobial class.
In addition to classification as ‘numeric’ or ‘categorical’, variables are further defined by what they measure (see Figure 1).
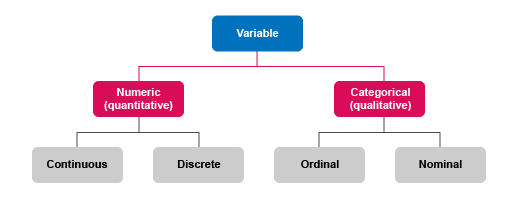
Numeric variables can be either continuous or discrete.
Continuous variables:
- represent measurements that can take any value within a range
- can be recorded using integers, fractions, percentages or decimals
- examples include milligrams of antimicrobial ingredient per kilo of bodyweight.
Discrete variables:
- represent counts of individual items or values
- are always recorded using integers (whole numbers)
- examples include the number of animals in a herd, number of different antimicrobials to which resistance is identified.
Categorical variables can be either nominal or ordinal.
Nominal variables:
- are classified into two or more categories that are mutually exclusive
- have no intrinsic order or ranking, or distance between the values
- when there are only two categories, this is known as a ‘dichotomous’ or ‘binary’ variable
- examples include antimicrobial class, pregnancy status and all yes/no questions.
Ordinal variables:
- comprise three or more categories that are ‘ordered’ or ‘ranked’, so that one value is ‘larger’ or ‘smaller’ than another value
- the distance, or gap, between values is not necessarily equal
- examples include body mass index (BMI) category (underweight, normal weight, overweight, obese) and resistance category (susceptible, intermediate, resistant).
The reason that variable classifications matter is that each one affects how data can be analysed, interpreted and used. You’ll learn more about this in the Processing and analysing data module. The key takeaway for this module, however, is to recognise that variable classifications are partly determined by the nature of the data unit that is being measured (for example, you can’t have half a person, so counts of people or animals are always discrete), and partly determined by how data are processed (such as when categorical variables are generated from continuous variables).
Activity 5: Classifying age variables
a.
Ordinal variable
b.
Categorical variable
c.
Continuous variable
d.
Discrete variable
The correct answer is a.
a.
Ordinal variable
b.
Categorical variable
c.
Continuous variable
d.
Discrete variable
The correct answer is c.
a.
Ordinal variable
b.
Categorical variable
c.
Continuous variable
d.
Discrete variable
The correct answer is a.
2.1.3 Datasets
A
Activity 6: Working with datasets
Look at Table 4.
| PatientID | DOB | Age | Gender | Date sample | Sample | Species | Methicillin |
|---|---|---|---|---|---|---|---|
| 1234 | 01/01/1960 | 60.8 | 1 | 01/02/2020 | Blood culture | S. aureus | R |
| 1235 | 01/01/1970 | 50.8 | 2 | 02/02/2020 | Nasal swab | Staphylococcus aureus | S |
Use the space below to answer the following questions:
- How many rows, how many columns, how many data units, how many data values are there in total?
- How is the dataset structured? (Hint: what do the rows and columns represent?)
- Can you describe the variables from the column headings alone? What additional information do you need to understand what the variables are?
- Can you classify the variables from the data values?
- Take a closer look at the variables. Can you identify which variables represent directly observed data and which variables represent data that has been processed through calculations performed on other variables, some of which might not be included in this dataset?
- Are there any possible errors in this data?
- Are there any inconsistencies in how the data are recorded in this dataset?
- What important variables are absent from this dataset that might make it difficult to use this information for AMR decision-making?
Answer
- Eight columns, three rows, two data units and sixteen data values. (Don’t count the header row which contains the variable names, as a data value.)
- Columns represents variables, rows represent data values for a single patient, i.e. a single data unit.
- The column names alone are insufficient to fully define the variables, though you might be able to guess for some of the common variables – e.g. ‘DOB’ means ‘date of birth’, and the column ‘Methicillin’ records the result of a methicillin susceptibility test. For the variable ‘Date sample’, it is unclear whether the first record represents the date ‘1 February 2020’, or ‘2 January 2020’, depending on which date format has been used. For the variable ‘Gender’, you cannot tell whether 1 refers to male, female or other. And finally, ‘Age’ is also ambiguous – does 50.8 refer to 50 years and 8 months (which would be 50.67 as a decimal)? You would need a data dictionary to accompany this dataset to be sure what each variable represents.
- PatientID = nominal, DOB = ordinal, Age = continuous, Gender = nominal, Date sample = ordinal, Sample = nominal, Species = nominal, Methicillin = we don’t know from this dataset. If only the categories of R and S had been used, this would then be a nominal variable. If the categories R, I and S had been used where I = intermediate, this implies a ranking with R>I>S in terms of level of resistance. This would be an ordinal variable.
- Age has been calculated from DOB. The methicillin variable is the result of a laboratory test. Depending on what test was used, it is possible that a
minimum inhibitory concentration (MIC) value was the original source of data and was categorised into resistant and susceptible categories based on the breakpoint as defined by the method used. Alternatively, if disk diffusion was used, the classification of R and S would have been derived from the diameter cut-off values, again as defined by the method used (usually EUCAST or CLSI). - DOB is recorded as the first of January at the start of a decade for both patients. This might be correct, but it might indicate a problem with recording DOB. It is impossible to tell with only two patient records, but we should be alert to the possibility of data entry errors.
- There is inconsistent recording of bacterial species name.
- There are many variables missing! For example, we might like to know the primary diagnosis. Patient ward is relevant, as if we had more data, knowing the patient ward would help to identify whether the patient might have been exposed to an outbreak of methicillin-resistant Staphylococcus aureus (
MRSA ). The origin of the infection – whether acquired in the community or in a healthcare setting, would help us to understand which settings are higher risk for acquiring MRSA. Antimicrobial use in the past three months might also be relevant for understanding whether methicillin or related drugs have previously been administered. We might also like information about the outcome of previous antimicrobial therapy, especially treatment failures. This is just a small sample of the additional information we might need – which examples would you add to this list?
2.1.4 Indicators
Many aspects of human and animal health related to AMR can be measured, but not all these measures are informative and useful. An
Most indicators are not directly observed and have to be calculated from the values of other variables. In special circumstances, such as the emergence of a new type of AMR, the observation of a single instance of AMR in one patient or animal might comprise an indicator that triggers an alert or response. However, in most cases, indicators are defined for facility-level data units such as hospitals, or geographic regions such as provinces or countries. This enables comparisons over time, over different geographic areas and across population groups.
Given their importance in supporting decision-making, indicator variables are required to have SMART characteristics:
- Specific: Indicators should measure a precise, operationally relevant target for improvement, monitoring or achievement. For example, rate of MRSA carriage in surgical inpatients should not exceed a particular threshold.
- Measurable: Indicators must be able to be precisely and accurately measured using validated, standardised instruments. For example, standard, internationally comparable units of measurement of AMR and AMU are important for constructing indicators.
- Achievable and attributable: Changes in the key outcomes that the indicator measures must be possible – an indicator that will not vary over time, and will not respond to interventions is not a good indicator. Additionally, changes in the outcome must be causally related (attributable) to changes in the indicator. For example, a decline in MRSA carriage should be attributable to improved preoperative screening and decolonisation of surgical patients.
- Relevant and realistic: When indicators are used as ‘benchmarks’ or ‘standards’, it must be possible that the desired outcomes can be reached. For example, an indicator measuring the number of weeks with zero resistant infections across the entire community in a year would not be relevant, because it is practically impossible that no resistant infections at all will occur.
- Time-bound: Changes in the indicator must be achievable within a relevant time frame. For example, indicators included in a
National Action Plan on AMR (NAP) should be expected to show change within the time period covered by the plan (most often three or five years). An indicator that refers to AMU or AMR in, say, 2050 would not be much help for evaluating a NAP.
Activity 7: SMART indicators of AMR
Return to the example dataset (Table 4). (Hint: go through all the characteristics to make sure the indicator you select is SMART.)
| PatientID | DOB | Age | Gender | Date sample | Sample | Species | Methicillin |
|---|---|---|---|---|---|---|---|
| 1234 | 01/01/1960 | 60.8 | 1 | 01/02/2020 | Blood culture | S. aureus | R |
| 1235 | 01/01/1970 | 50.8 | 2 | 02/02/2020 | Nasal swab | Staphylococcus aureus | S |
Answer
One example of an indicator is the percentage of hospital inpatients who develop MRSA blood infections in a calendar year. Here’s why it is a SMART indicator:
- Specific: This indicator could be measured for a single hospital ward, the whole hospital, a region or a country, and be used to evaluate progress against targets in these settings.
- Measurable: It can be measured using standard protocols for sampling, bacterial identification and AST.
- Achievable and attributable: It is a measure of the quality of infection prevention and control in healthcare settings – hospitals with a higher percentage of patients developing MRSA infections can be targeted with interventions to improve infection prevention and control practices.
- Relevant and realistic: MRSA is associated with increased length of hospital stay, more severe disease and increased risk of death – therefore, this is an important indicator of patient outcomes, which might vary between hospitals, regions or countries.
- Time-bound: The time period for monitoring this indicator (one calendar year) is clearly specified.
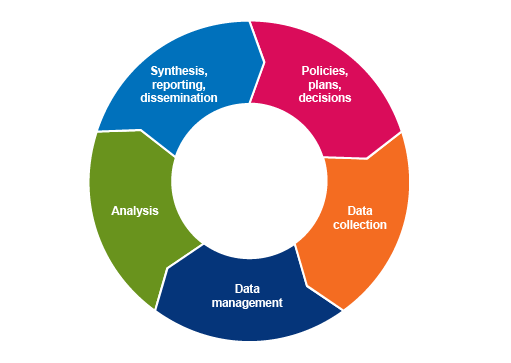
2.2 The information cycle
The process of turning data into relevant, useable information that supports evidence-based decision-making can be represented as an information cycle (Figure 2). Information is obtained by collecting, managing, analysing, interpreting and reporting data, and forms the basis for designing interventions or formulating policies. All policies, plans and decisions require further data to assess how well they are working (monitoring and evaluation) and improve their design and implementation. Therefore, the process of turning data into information is a continuous cycle.
You will learn more about data collection, processing, analysis, and synthesis and reporting in the later data modules. For now, consider the following points:
Data collection
Data collection refers to all the steps involved in obtaining data from their source. Sources of data are described in more detail in the next section. It also involves decisions about which data to collect – which data units, where, and how many – this is referred to as ‘sampling’ and is covered in detail in the Sampling module.
Data management
Data management refers to a set of processes for preparing collected data into a form suitable for analysis. This includes processes such as data entry, checking for errors and other quality assurance (QA) measures, integrating two or more data sources, and creating indicator variables. It also includes ensuring data are stored securely and in accordance with relevant governance and ethical requirements (see the module on Legal and ethical considerations in AMR data), and can be securely accessed by authorised users (such as government veterinarians or hospital administrators who have responsibility for reporting). Data management systems, including database software and protocols, need to be designed to be user-friendly for data collectors and providers as well as data managers, and informed by their level of training and real-world working conditions. You will learn more about data management in the module on Processing and analysing data.
Data analysis
Data analysis is about identifying and summarising meaningful patterns in data that are of value to a range of stakeholders, from the data collectors and providers, to national governments and international organisations. Data analysis includes processes for describing and summarising data, investigating relationships between variables, and assessing whether there is evidence that one variable (an ‘exposure’ variable) is a ‘cause’ of another variable (the ‘outcome’ variable). In AMR data analyses, the exposure variables are usually those related to the potential risk factors (such as AMU), and the outcome variable is the resistance category or value.
Data analyses can be presented as statements, in tables, as charts, maps and even infographics and other pictorial forms. You will learn more about summarising and presenting data in the modules Processing and analysing data and Summarising and presenting AMR data.
3 AMR data sources
You should by now understand the importance of data for AMR decision-making, but where do AMR data come from?
Activity 8: AMR data sources in the workplace
Use the space below to answer the following questions:
- Take a few moments to think about and write down possible sources of AMR data in your own workplace.
- Now think about sources of AMR data in other workplaces, including human, animal and environmental health settings.
- What about AMU and AMC data? Take a few moments to think about possible sources of AMU and AMC data in your own workplace.
- Now think about sources of AMU and AMC data in other workplaces, including human, animal and environmental health settings.
- Reflecting on your answers to questions 1–4, what are some of the key characteristics of the types of data sources you have identified? How are they similar to and how are they different from each other?
Discussion
How did you get on with this activity? Did you identify data that you need to collect yourself? Did you identify data that are already being collected as part of an ongoing program? Did you consider data that can be obtained from reports or scientific papers?
There are three broad classifications of data sources: primary, secondary and tertiary. All types are relevant sources of AMR data, and each type has distinct advantages and disadvantages, which are summarised in Table 5.
| Type of data source | Description | Advantages and disadvantages | AMR data examples |
|---|---|---|---|
| Primary | Data that are collected or generated directly from the source, through methods such as surveys, interviews, routine record keeping, laboratory tests or experiments. | Primary data have the highest level of information potential – e.g. numeric data that are collected as continuous variables rather than as categorical variables. However, primary data may not be collected in standardised formats unless collected as part of a study and can be resource-intensive to generate. | An extract from a laboratory information management system database that records every AST result in the past year. A survey of use of antimicrobials in large commercial farms. |
| Secondary | Existing data are accessed and analysed by someone other than the person(s) who collected the data. The original data might be transformed into a different format to enable secondary data analysis. | Adds value to the primary source data by summarising, collating and comparing across settings or populations, and interpreting the data. However, as the primary data were collected for a different purpose, they may not be completely suitable to answer the objectives of the secondary data analysis. | National and international AMR surveillance databases. Research studies that use routinely collected human and animal health data to address AMR-related research questions. |
| Tertiary | Data from secondary sources are synthesised to add information. | By integrating data from numerous sources, tertiary data represent condensed, highly relevant information that can be an authoritative source for a wide range of stakeholders. However, summarised secondary data may have reduced information, for example, data may not be reported separately for males and females. | Systematic reviews and meta-analyses of AMR-related data, such as estimates of the global prevalence of AMR. |
Activity 9: Identifying data sources in different workplaces
Revisit your answers to Activity 8. Which primary data sources did you identify in the different workplaces? Which secondary and tertiary sources did you identify?
Table 6 presents some examples of primary, secondary and tertiary AMR, AMU and AMC data.
| Topic | Primary sources | Secondary sources | Tertiary sources |
|---|---|---|---|
| AMR | Routine testing of bacterial pathogens isolated from urine samples in patients presenting at primary care facilities. Sampling of bacteria from poultry carcasses at slaughterhouses (abattoirs). Sampling of bacteria from environmental water sources such as rivers. Sampling of bacteria from animal products at markets. | Results from research studies published in technical reports or scientific journals. Quarterly reports published by a country’s ministry of health or ministry of agriculture. Integration and analysis of routinely collected health facility and laboratory data from multiple jurisdictions. GLASS database of global AMR data. | Systematic review and meta-analysis of global prevalence of antibiotic resistance in Helicobacter pylori (Savoldi et al., 2018). WHO annual global reports on AMR surveillance. |
| AMU | Medical or veterinary records of antimicrobial medicines given to patients or animals. Surveys of patients or farmers about antimicrobials purchased and used. Wastewater and environmental sampling to detect antimicrobial residues. | Results from research studies published in technical reports or scientific journals. Quarterly reports published by a country’s ministry of health or ministry of agriculture. Summary of results of antimicrobial residue testing in aquaculture species. | Global modelling study of the current and projected trends in AMU in livestock production (van Boeckel et al., 2015). |
| AMC | Pharmaceutical company antimicrobial medicines stocktaking records. Pharmacy or agriculture supply shop sales records. Government customs (import) records for antimicrobial medicines licensed for medical or veterinary use. | Government reports of antimicrobial ingredient or product import and manufacture at national level. World Organisation for Animal Health (OIE) Annual report on antimicrobial agents intended for use in animals. | FAO reports summarising and interpreting trends on global antimicrobial consumption in livestock based on the OIE Annual report on antimicrobial agents intended for use in animals. |
Activity 10: Reflecting on data sources
Reflecting on Table 2, were there any data sources that surprised you? Prior to reading this table had you identified potential data sources from sectors other than the one in which you work – for example, if you’re a medical professional, did you identify sources of AMR, AMU and AMC data in animals? If you work in a laboratory, did you consider the relevance of records collected by national medicines agencies, customs and quarantine authorities, and other regulatory authorities? What does this summary tell you about the importance and challenges of implementing One Health approaches to AMR surveillance?
Finally, you may have also noticed that some of these data sources reflect ‘routine’ data collection activities, such as medical and customs records, whereas other data sources represent activities conducted periodically or sporadically, such as annual surveys, and still others only when an outbreak occurs.
Routine health data are collected at the service delivery level – for example, a health facility, veterinary practice, pharmacy, farm, or laboratory. These data are collected on a regular, continuous basis through individual records, registers and electronic systems. They relate to vital events, patient demographic and clinical characteristics, laboratory results, infrastructure, the health and veterinary workforce, commodities and finances. These sources provide data that inform service delivery, progress towards program objectives and national policy. Routine health data can also be reported in a summarised form on a monthly or quarterly basis and then aggregated at district, regional and national levels – when accessed in this form, they represent secondary data.
A major advantage of routine data collection is that it captures data on large populations and reflects what happens under real-world conditions – for example, antimicrobial prescribing practices in day-to-day work might be different from self-reported prescribing practices whilst participating in an antimicrobial stewardship program. Once the data have been collected, they are much cheaper to access and use compared to conducting a survey or starting a new surveillance program. However, there are limitations, including that the data are not collected for the purpose of the research or analysis of interest, which means that important variables might be missing. Routinely collected data are often of poorer quality than data collected specifically for research purposes, and might not be representative of the entire patient or animal population. For example, sometimes only patients who have failed first-line treatment have samples collected and submitted for culture and susceptibility testing, particularly in low-resource settings. Where this is the case there will be limited data available on patients with uncomplicated infections.
Non-routine health data sources are data collected through activities such as surveys, which may comprise questionnaires, collection of biological samples, or both. People, animals and the environment can all be surveyed. These surveys are conducted periodically or on a one-off basis and provide data meant to answer specific questions. Surveys can be large-scale and population-based (such as a census), sample-based (such as behavioural surveys) and/or focused on specific entities or institutions (such as program evaluations, veterinary facility assessments, or patient satisfaction questionnaires). A major disadvantage is that these data sources can be costly to collect as they may require additional staff and may be difficult to repeat. For example, a single survey is useful for understanding AMR at a particular time point, but unless a survey is repeated every year it will lose relevance as time goes on. You will learn more about different types of samples in the Sampling module.
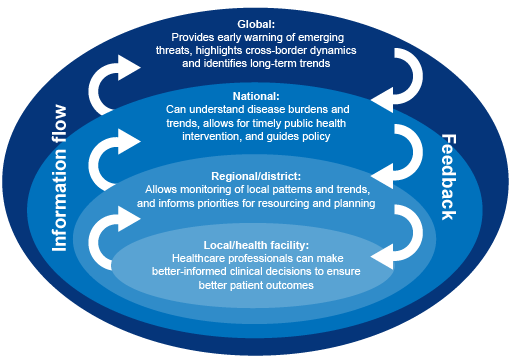
4 Measuring AMR, AMU and AMC to support decision-making
AMR, AMU and AMC are measured and used at different levels and in different sectors – from hospitals or farms or laboratories, to national governments, to international organisations. Information about AMR, AMU and AMC addresses different needs at different levels. For example, local-level AMR data are important for clinical decision-making (choosing the best treatment for an individual patient), whereas national and global-level AMR data can provide an early warning of emerging AMR threats. Data collected at local level therefore inform international decision-making. Equally, information compiled at international level can influence local-level practices. For example, emergent AMR detected nationally or internationally might lead to a change in local prescribing guidelines. Figure 3 presents an example of how AMR information is used at different levels in public health.
Activity 11: Diagram to show human or animal health
Draw a similar diagram for AMU or AMC information in human health, or AMR, AMU or AMC information in animal health. Where might public and animal health intersect in this information flow?
4.1 How is AMR measured?
Other modules have introduced the process of testing bacteria for antimicrobial resistance. The process involves isolating the target bacteria and conducting susceptibility testing for one or more antimicrobials. Depending on the type of testing performed, the results might be reported as the minimum inhibitory concentration (MIC), or as the resistance category (e.g. susceptible, intermediate or resistant).
Across human and animal health there are three broad indicators for AMR:
- Proportion of specimens from which a target pathogen was isolated: This is usually reported for specimens from livestock and aquatic animals, as sampling is often performed on healthy animals that are about to enter the food chain. Target pathogens are usually
zoonotic pathogens (disease-causing bacteria that can be transmitted from animals to people) or, if looking for possible reservoirs of resistance genes, might also focus oncommensal bacteria (bacteria that are naturally present but do not usually cause disease). In human health it is often reported for screening programmes, for example MRSA screening. - Proportion of isolates that were resistant to each antimicrobial: This is a commonly used indicator in livestock, aquatic and human AMR surveillance.
- Minimum inhibitory concentration: Results from broth/agar dilution testing are often presented as distributions of MICs for particular isolates and antimicrobials, which can be used to develop breakpoints to distinguish between resistant and wild-type organisms.
These indicators are often categorised by the population level and type. AMR may be measured and reported at a specific site such as a hospital, or across all hospitals in the country. Results are also often reported according to the specific population to which they apply. For example, in a livestock study the proportion of resistant isolates from commercial broilers may be presented, but you can’t assume that the results would be the same for backyard poultry. In public health, a distinction is made between patients staying in hospital compared to patients in the community.
The Global Antimicrobial Resistance Surveillance System (GLASS) is the main global surveillance system for AMR in human health. GLASS reports provide an example of how AMR is measured at global level. You can also refer to the module Introducing AMR surveillance systems for more information.
4.2 How are AMU and AMC measured?
AMU and AMC are also measured at different levels. Measuring AMU at a single site (such as a hospital or pharmacy) is useful for developing local prescribing guidelines and evaluating the impact of antimicrobial stewardship programs. AMU data at site level can also feed into surveillance systems that integrate data from multiple surveillance sites. There are many indicators that can be used to measure AMU at a single site. The Systems for Improved Access to Pharmaceuticals and Services (SIAPS) program, supported by USAID, describes four categories of indicators that could be used in hospitals to monitor AMU (Systems for Improved Access to Pharmaceuticals and Services (SIAPS) Program, 2012). Each of these categories, along with a few example indicators is shown in Table 7.
| Category | Example indicators |
|---|---|
| Hospital management | Existence of standard treatment guidelines Availability of key antimicrobials in hospital stores on the day of the study |
| Prescribing | Percentage of hospitalisations with one or more antimicrobials prescribed Average percentage of antimicrobials prescribed consistent with a hospital formula list or according to approved guidelines |
| Patient care | Average duration of a hospital stay in patients who receive antimicrobials |
Quantifying the amount of antimicrobials that are taken by humans or animals is not always straightforward. At first it might seem simple – we could just count the number of tablets a patient takes, for example. But in fact there is a substantial amount of variation that makes it challenging to make AMU data comparable across different data units, settings and sectors. For example:
- There are multiple routes of administration, include oral, parenteral, rectal, intramuscular injections, and as part of medicated feed and water in terrestrial and aquatic animals.
- The concentration of active antimicrobial ingredient varies in different products and formulations (for example, tablet versus liquid forms).
- Patients and animals receive different amounts (doses) according to their age and bodyweight.
- A treatment course may be administered as a high dose in a single day, or a lower dose taken daily for several days.
- Informal/non-prescribed use, e.g. over-the-counter purchases.
4.2.1 Defined daily dose
In human health, the WHO has recommended a unit of measurement for AMU for surveillance purposes called a
There are several indicators that do use DDD to measure AMU. For example, a common DDD indicator for AMU in hospital inpatients is the number of DDDs per 100 occupied bed-days. This is calculated as:
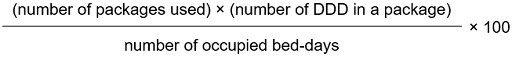
The number of DDD in a package is looked up from standard reference tables maintained by the WHO.
More information about DDD indicators and how to calculate them is available online.
The main advantage of the DDD is that it allows for consistent comparisons in AMU between different settings and over time. This makes it particularly useful for comparing AMU between countries, evaluating the effectiveness of antimicrobial stewardship programs from different sites, and monitoring changes in use of a particular class of antimicrobial from one year to the next.
4.2.2 Milligrams of antimicrobial ingredient adjusted for animal biomass
In animal health, there are rarely sufficient data available to calculate a DDD indicator, though this is recommended where possible. Instead, the OIE has proposed a standard unit of measurement for AMC in animals, which is the milligrams of antimicrobial ingredient sold per kilogram of animal biomass (mg/kg). Like the DDD, the mg/kg estimate aims to enable comparison in AMC between settings and over time. The mg/kg is a ratio of the two quantities below:
- The amount of antimicrobial ingredients sold in medicines intended for use in animals. This can be sourced from national customs and manufacture records and is compiled annually by national veterinary medicine regulatory authorities.
- The total amount of animal
biomass (that is, the total weight of all animals). The unit ‘biomass’ was developed to counter the challenges of comparing AMC in every type of farmed animal, from horses to fish, and at different stages of the production cycle (such as from piglets, which weigh less than 2kg at birth, to butcher hogs, which typically weigh 70–100kg at the time they are slaughtered). There are differences in the body weight of common livestock animals between countries due to differences in breeds, nutrition and other factors. To enable standardised comparisons, the OIE publishes a reference table of standard animal biomass for different species averaged across different production stages. To calculate total biomass, you then multiply the total number of farmed animals per species (which can be obtained from a national livestock census and/or slaughterhouse records) by the reference biomass value.
There are other standard units of measurement of AMC in animals, such as ‘mg of antimicrobial ingredients per Population Correction Unit (PCU)’. Unlike the biomass measure used by the OIE, the PCU specifically takes into account differences in AMU at different production stages and takes into account the fact that the majority of AMU occurs in relatively young animals below their typical weight at slaughter. However, many countries do not have the data available to calculate PCUs. (More information about this approach is available.)
5 Error, bias and validity
When we conduct an analysis of AMR-related data, we are aiming to estimate quantities such as the true level of AMR in a defined population, or the true relationship between an exposure and an outcome. However, AMR-related data sources, and our methods for collecting, managing and analysing data, are not perfect – in fact, no data sources can be perfect. Error occurs when observed, measured or calculated values differ from the true value.
Sources of error are often divided into three categories:
- A
random error is the error that occurs due to chance alone. It most commonly arises from having small sample sizes. For example, if you toss a fair coin hundreds of times, you would find that close to 50% of your tosses land on ‘heads’, and close to 50% land on ‘tails’. This result approximates the ‘truth’, which is that there is a 50% chance of a ‘heads’ or ‘tails’ result from tossing such a coin. However, if you only tossed a coin three times, it is possible that just by chance, you get three ‘heads’ in a row. In fact, the probability is quite high, it is one in 23 (one in eight, or 12.5%). Based on this small sample, you might conclude that the chance of getting ‘heads’ is 100%. This would be random error. Aconfidence interval and tests of statistical significance (p-value s) are used to assess whether a finding is likely to be due to chance. There is more detail on random error in the Processing and analysing AMR data module. - A
systematic error (or bias) is an error that represents a consistent deviation from the true value, and can arise during design, data collection, data management or analysis stages in AMR surveillance systems or studies. For example, if only patients who fail first-line antimicrobial treatment are sampled for AST, then estimates of the prevalence of AMR might consistently exceed the true population value. Confounding is a type of bias that occurs when a conceptual error in understanding an observed association between two variables leads to the ‘wrong explanation’. It occurs when the true relationship between an exposure and an outcome is distorted by a third variable, called a ‘confounder’. The third variable is associated with both the exposure and the outcome, but it doesn’t cause the outcome. A simple example is that grey hair is associated with cancer, but as we know, grey hair doesn’t actually cause cancer, it is confounded by its association with age (as older people have grey hair and are more likely to get cancer). There are no statistical tests for confounding – it is a type of conceptual error that has to be taken into account when we plan, conduct and report data analyses.
5.1 Bias in AMR studies
In this module, the focus is on systematic bias, as this includes the types of error of most relevance to studies and analyses using AMR-related data. Systematic bias can be further broken down into four different sources of error and bias (Figure 4).
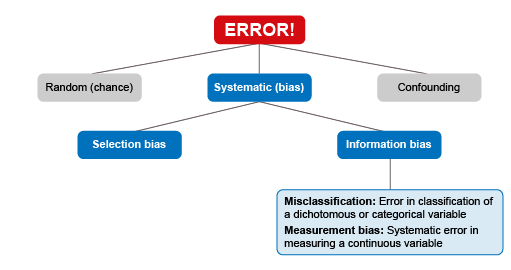
5.1.1 Selection bias
Selection bias occurs when individuals or groups in a study (the ‘study population’) differ systematically from the population of interest (the ‘target population’).
Activity 12: Selection bias in the workplace
Take a look at the real-world example of selection bias that is described in Video 1. Can you think of an example of selection bias that might apply in your workplace?
In AMR studies, selection bias occurs often when patients are selected because they are sick with a bacterial infection, and their clinician has requested testing. The results of this testing are then often included in a study or surveillance system. If these findings are used to make inferences about the level of AMR in the general population, this is would likely lead to an overestimate of the frequency of AMR. Selection bias can also arise even if the findings are not inferred to reflect the general population, but only hospital patients. For example, in most countries, tertiary referral hospitals in capital cities receive patients with critical or complex illnesses from all over the country, who are transferred from the first hospital or health facility they attended. These hospitals are also often the best equipped to conduct a study on AMR.
So, if a study is performed on AMR in a tertiary referral hospital, and the results are used to draw conclusions about the frequency of AMR in hospitals in the same country in general, the findings might be biased by the fact that the patients in this study are sicker on average (and perhaps more likely to have resistant infections) than the average hospital patient in the country. On the other hand, tertiary referral hospitals often have better infection prevention and control practices than other hospitals, and so despite the fact they have sicker patients on average, they might have lower frequencies of AMR because of their improved infection prevention and control. It’s not always straightforward to predict how selection bias might affect the results!
Selection bias can also affect studies in animal populations. For example, it is common to sample broiler (meat) chickens for resistant pathogens at slaughterhouses. This makes a lot of sense – it is an efficient way to sample a large number of birds, and as the meat is then sold for human consumption, it is an important time point for evaluating the risk of transfer of AMR infections from food animals to humans. However, typically only healthy animals reach the stage of being sent to the slaughterhouse – sick birds may die or are euthanised before reaching the end of the production cycle. If those birds were sick with a bacterial infection, they might have been more likely to have had a resistant infection that did not respond to any treatment attempted by the farmer or veterinarian (including antimicrobial medicines in animal feed or water). This means that the results of a study of AMR in broiler poultry when samples were collected from slaughterhouses might underestimate the frequency of AMR in broilers overall.
Selection bias can be a particular issue in settings where people (patients or farmers) have to pay a fee for their samples to be tested. Depending on how expensive the fee is compared to typical incomes, it can be the case that sampling and testing for AMR is only performed on a subset of patients (or animals owned by farmers) who can afford it. These wealthier patients (or the animals the farmers raise) might be healthier on average and have different risks of AMR infections compared to the general population.
Activity 13: Test your understanding
Read the following case study:
A clinical researcher designs a study that aims to understand the prevalence of Staphylocccus aureus resistant to methicillin (MRSA) in Indonesia. They have data on more than 5000 postoperative inpatients who had samples collected and tested for MRSA in the past year at a large hospital in Jakarta. Results show that 87% of S. aureus isolates are resistant to methicillin.
The researcher concludes that the prevalence of MRSA is around 87% in Indonesia.
What is wrong with this conclusion? Select your answers in the drop-down boxes below.
5.1.2 Information bias
- Differential misclassification is where the probability of an exposure being misclassified depends on outcome status. For example, a patient is more likely to remember whether they previously stopped taking antibiotics halfway through the prescribed course, if they are diagnosed with a resistant infection. This is known as ‘recall bias’.
- Non-differential misclassification is when the probability of misclassification does not depend on the outcome status. For example, the chance of the species of a fish being wrongly identified is the same regardless of whether they carry resistant pathogens or not.
Activity 14: Information bias in the workplace
Think about your workplace. What are some possible sources of information bias affecting AMR-related data in your organisation? What might be the implications for the results of any AMR surveillance performed at your organisation? Record your response in the box below.
5.2 Validity and interpretation of AMR studies and surveillance
5.2.1 Accuracy and precision
Accuracy describes how close the measured value is to the true value. In particular, it is affected by systematic error.Precision describes the extent to which measured values for the same parameter are similar to each other when the measurement is repeated many times. In particular, it is affected by random error.
Activity 15: The theory of accuracy and precision
Watch Video 2 to better understand the concept of accuracy and precision.
As you will now appreciate, it is not particularly helpful to have a measurement that is accurate but not precise, or precise but not accurate. You need to aim for both!
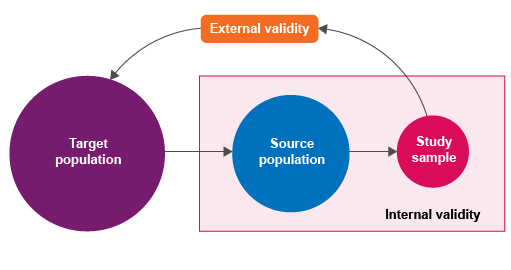
5.2.2 Validity
target (reference) population – the population to which the results will be applied or extrapolatedsource (study) population – actual population from which eligible study subjects are drawnstudy sample – the units selected from the source populationsampling unit – the epidemiological unit in which we are measuring exposure and outcome (e.g. individual animals or herds). The term ‘sampling unit’ has the same meaning as data unit in this context.
There is more information about these concepts in the modules on Sampling.
As shown in Figure 5, validity can be divided into:
internal validity – the degree to which study results are representative of true study population values: the ‘truth’ within the studyexternal validity – the degree to which study results can be extrapolated to the target population: the ‘truth’ outside the study.
Activity 16: Validity in your workplace
Think about your own workplace. What populations are sampled? For example, does your organisation mainly treat or conduct testing on healthy individuals, or sick individuals (people or animals)? What are the implications for internal and external validity? What can be done to improve the validity of your studies?
Discussion
Here are some suggestions for improving validity:
- Make sure you are sampling representative data points. For example, don’t just sample broiler chickens reared in a large commercial farm if you want to learn about AMR in chickens in a country where most chickens are raised by smallholders.
- Evaluate the validity of a study when interpreting its results. Don’t make conclusions at a population level based on a study with a biased, non-representative sample.
- Increase access to training like this module to educate your colleagues and peers on the importance of validity.
6 End-of-module quiz
Well done – you have reached the end of this module and can now do the quiz to test your learning.
This quiz is an opportunity for you to reflect on what you have learned rather than a test, and you can revisit it as many times as you like.
Open the quiz in a new tab or window by holding down ‘Ctrl’ (or ‘Cmd’ on a Mac) when you click on the link.
7 Summary
In this module you have been introduced to many important aspects of data, including AMR data.
Congratulations on making it this far!
You have seen that in order for data to be useful, it needs to be transformed into information that can be used to support evidence-based decision making, policy formulation and program design. Information needs are best represented as a cycle – each stage of data collection, management and analysis to support decision-making can lead to more questions and gaps to address, prompting the cycle to continue. You have become familiar with the core concepts and properties of data, including how its classifications and measurements affect the way that it is processed and analysed. You have learned to identify the characteristics of a good AMR indicator, and how indicators can help to answer important questions on how to tackle AMR. You have reviewed common sources of AMR-related data and explored the flow of AMR data at different levels in surveillance systems. Finally, you have learned to identify common sources of error and bias that affect analyses of AMR-related data, as well as some strategies to reduce these errors and biases.
You should now be able to:
- explain why it is important to measure AMR, AMU and AMC data
- identify different types of AMR, AMU and AMC data
- explain how data become useful and lead to informed decision-making in the AMR response
- identify and explain potential sources of error and bias that affect the quality and reliability of AMR, AMU and AMC data.
Now that you have completed this module, consider the following questions:
- What is the single most important lesson that you have taken away from this module?
- How relevant is it to your work?
- Can you suggest ways in which this new knowledge can benefit your practice?
When you have reflected on these, go to your reflective blog and note down your thoughts.
Activity 17: Reflecting on your progress
Do you remember at the beginning of this module you were asked to take a moment to think about these learning outcomes and how confident you felt about your knowledge and skills in these areas?
Now that you have completed this module, take some time to reflect on your progress and use the interactive tool to rate your confidence in these areas using the following scale:
- 5 Very confident
- 4 Confident
- 3 Neither confident nor not confident
- 2 Not very confident
- 1 Not at all confident
Try to use the full range of ratings shown above to rate yourself:
When you have reflected on your answers and your progress on this module, go to your reflective blog and note down your thoughts.
8 Your experience of this module
Now that you have completed this module, take a few moments to reflect on your experience of working through it. Please complete a survey to tell us about your reflections. Your responses will allow us to gauge how useful you have found this module and how effectively you have engaged with the content. We will also use your feedback on this pathway to better inform the design of future online experiences for our learners.
Many thanks for your help.
References
Acknowledgements
This free course was collaboratively written by Claire Batty, Melanie Bannister-Tyrrell, Emma Zalcman and Clare Sansom, and reviewed by Liz Sheridan, Claire Gordon, Natalie Moyen, Ben Amos, Rachel McMullan and Hilary MacQueen.
Except for third party materials and otherwise stated (see terms and conditions), this content is made available under a Creative Commons Attribution-NonCommercial-ShareAlike 4.0 Licence.
The material acknowledged below is Proprietary and used under licence (not subject to Creative Commons Licence). Grateful acknowledgement is made to the following sources for permission to reproduce material in this free course:
Module image: Hannu Viitanen/123RF.
Figures 1–5: Ausvet Pty Ltd.
Table 7: Systems for Improved Access to Pharmaceuticals and Services (SIAPS) Program (2012) How to Investigate Antimicrobial Use in Hospitals: Selected Indicators, submitted to the US Agency for International Development, Arlington, VA: Management Sciences for Health.
Every effort has been made to contact copyright owners. If any have been inadvertently overlooked, the publishers will be pleased to make the necessary arrangements at the first opportunity.