Use 'Print preview' to check the number of pages and printer settings.
Print functionality varies between browsers.
Printable page generated Sunday, 12 July 2026, 1:06 PM
Introducing AMR surveillance systems
Introduction
Antimicrobial resistance is a serious global public health problem. This course introduces you to AMR surveillance systems and the One Health approach to AMR surveillance, and provides an overview of the relationships between AMR surveillance systems in humans, animals and the environment. It also introduces local, national and global AMR surveillance networks and covers the functions of these networks, the types of data that are collected and the uses of this data. Finally, it takes you through surveillance system design using examples. This course builds on concepts and learnings from the course An introduction to surveillance. You should start by watching Video 1, which introduces the importance of AMR surveillance (CDC, 2018a).
After completing this course, you will be able to:
- describe the objectives and requirements of AMR surveillance systems
- describe the One Health approach to AMR surveillance
- outline the differences between AMR, AMU and AMC surveillance
- describe the types of data collected by surveillance networks
- provide examples of AMR surveillance systems in humans and animals
- outline the importance of and relationships between local, national and global AMR surveillance networks and systems
- explain integrated surveillance systems, providing examples
- identify local and national surveillance networks or systems relevant to your work context
- describe how surveillance systems can be designed.
In order to achieve your digital badge and Statement of Participation for this course, you must:
- click on every page of the course
- pass the end-of-course quiz
- complete the course satisfaction survey.
The quiz allows up to three attempts at each question. A passing grade is 50% or more.
When you have successfully achieved the completion criteria listed above you will receive an email notification that your badge and Statement of Participation have been awarded. (Please note that it can take up to 24 hours for these to be issued.)
Activity 1: Assessing your skills and knowledge
Before you begin this course, you should take a moment to think about the learning outcomes and how confident you feel about your knowledge and skills in these areas. Do not worry if you do not feel very confident in some skills – they may be areas that you are hoping to develop by studying these courses.
Now use the interactive tool to rate your confidence in these areas using the following scale:
- 5 Very confident
- 4 Confident
- 3 Neither confident nor not confident
- 2 Not very confident
- 1 Not at all confident
This is for you to reflect on your own knowledge and skills you already have.
1 How do we define surveillance?
the ongoing, systematic collection, analysis, and interpretation of health-related data essential to planning, implementation, and evaluation of public health practice, closely integrated with the timely dissemination of these data to relevant public health stakeholders to inform action at a local, national or global level.
In clearer language, surveillance is the routine collection of health-related data, analysis of these data and feedback of the results, and interpretation to the relevant stakeholders. Surveillance is a widely used public health activity for many forms of infectious and non-infectious diseases. Surveillance is not in itself a scientific research activity, though some research projects make use of data that are collected in surveillance systems. Sometimes, surveillance systems in
2 What is AMR?
As noted in other courses, this course focuses on bacteria and will generally use AMR to mean bacterial resistance to antibiotics, but strictly speaking, AMR encompasses all the different micro-organisms.
Antimicrobials are used to treat infections in humans, animals (terrestrial and aquatic, companion and food-producing), and plants (crops, fruit trees, ornamental, etc). As antimicrobial resistance is a growing global issue across all sectors and since antimicrobials used in one sector can contribute to the emergence and spread of AMR in other sector(s), a ‘One Health approach’ is needed to fight AMR. (See more on One Health in the course Introducing a One Health approach to AMR.)
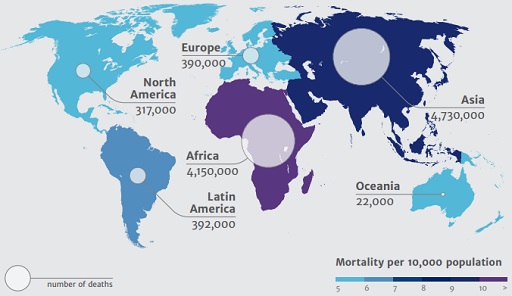
It is clear that antimicrobial resistance is an unavoidable evolutionary consequence of the selective pressure resulting from the use of antimicrobials. However, strategic decision-making and coordinated action at local, national and global levels to promote the prudent use of antimicrobials is key to mitigate the spread of resistance and the resulting morbidity and mortality. Figure 1 below, taken from the Review on Antimicrobial Resistance (also referred to as the O’Neill Report) highlights the projected mortality in humans in 2050 as a consequence of AMR. A more recent forecast suggests that 1.56–2.26 million deaths attributable to AMR and 6.85–9.65 million deaths associated with AMR could occur globally in 2050 (GBD 2021 Antimicrobial Resistance Collaborators, 2024).
2.1 The importance of AMR surveillance
As you saw in Video 1, AMR surveillance is central to:
- assessing the scale of the AMR problem at a local, national or global level
- measuring patterns of AMR over time in a particular place or places
- informing public health policies on antimicrobial usage
- improving health outcomes in people and animals.
Surveillance is one of the five strategic priorities to tackle the rise in AMR globally (WHO, 2015) as outlined in the Global Action Plan (GAP) on AMR.
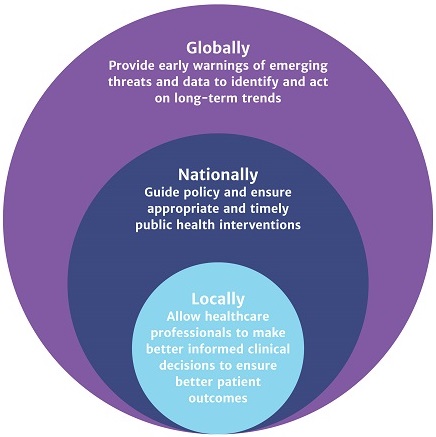
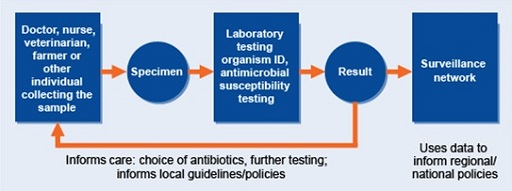
Surveillance data (animal or human) can be utilised to support patient care by informing treatment decisions (i.e. choice of therapy). Individual results might be used to determine treatment for a patient, and, when aggregated and analysed at local and/or national level, surveillance data can inform prescribing guidelines (Figure 2).
2.2 Why is a One Health approach needed to fight AMR?
The concept of ‘One Health’ is covered in detail in the course Introducing a One Health approach to AMR, but here is a summary:
As you saw above, antimicrobial resistance can spread between humans, animals, plants and the environment, and it is therefore important to take a ‘One Health’ approach to AMR surveillance. The WHO defines ‘One Health’ as ‘an approach to designing and implementing programmes, policies, legislation and research in which multiple sectors communicate and work together to achieve better public health outcomes’ (WHO, 2017). The WHO’s Global Action Plan on AMR recommends that in practice AMR surveillance systems should include data from all sectors, and that there is a coordinated effort across local, national and global levels (Figure 2) to mitigate the risk posed by AMR (WHO, 2015).
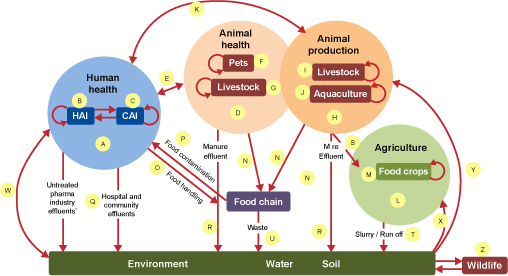
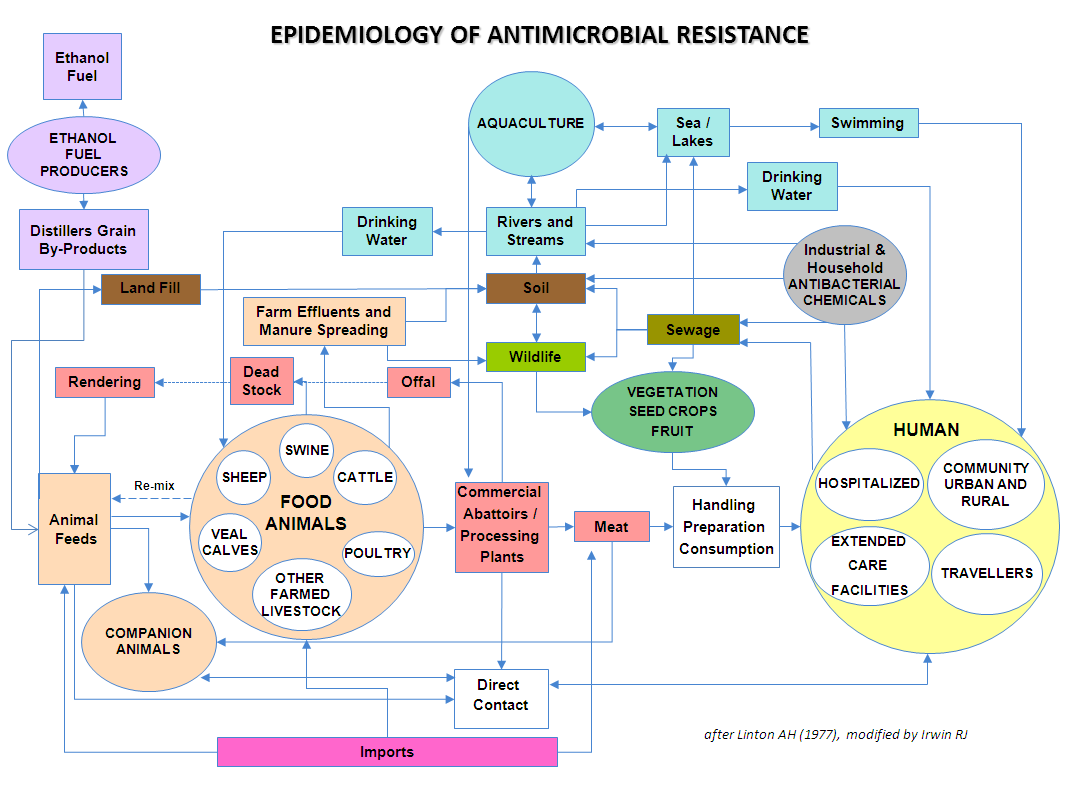
Figure 3 shows some of the ways that antimicrobials and antimicrobial resistant bacteria can travel around the environment and come into contact with humans, animals and the environment, reiterating the importance of a
Therefore, a quadripartite partnership composed of the United Nations agencies the World Health Organization (WHO), the Food and Agriculture Organization (FAO), the
- ensure that antimicrobial agents continue to be effective and useful for curing diseases in humans and animals
- promote the prudent and responsible use of antimicrobial agents
- ensure global access to medicines of good quality.
These organisations have each produced their own action plan to achieve these joint goals. You will learn more about the plans in the following activity.
Activity 2: Global action plans
Each of the first three members of the quadripartite has produced an action plan for AMR:
- Global Action Plan on Antimicrobial Resistance (WHO, 2015)
- Strategy on Antimicrobial Resistance and the Prudent Use of Antimicrobials (WOAH, 2022)
- The FAO Action Plan on Antimicrobial Resistance 2021–2025 (FAO, 2021)
Have you seen any of these action plans before taking this course? It’s fine if you haven’t, as this activity will familiarise you with them.
Spend some time familiarising (or refamiliarising) yourself with the objectives in these documents by clicking on the links above. Look particularly at:
- WHO: find the five objectives listed in ‘Strategic objectives’ (p. 8).
- WOAH: find the four objectives listed on pp. 7–10.
- FAO: find the five objectives listed on p. 11.
Now answer the following questions.
- Copy the blank table in the space below and list the objectives from each document. What do you notice about the objectives between the different agencies?
| Objectives | My activities that relate to these | |
|---|---|---|
| WHO | ||
| WOAH | ||
| FAO |
- Now note down as many responsibilities and/or tasks in your own job that you see as contributing to the objectives included in any one of the action plans on AMR.
Don’t worry if you cannot make any links between your work and these objectives – this just might not be possible.
2.3 AMR, AMU and AMC – what are the differences?
Surveillance of AMR can track changes in bacterial resistance patterns over time in order to inform treatment strategies at a local level, policy decisions at a national level, and global strategy to mitigate the risk of resistant infections and the associated morbidity and mortality in the human, animal and agricultural sectors.
Antimicrobial use, or AMU, refers to data on the antimicrobials taken by individual patients (humans or animals). Data are collected at patient level, which allows for a more comprehensive set of data to be gathered, such as information on indication, treatment regimen, route of administration and patient characteristics. In general, the collection of data on antimicrobial use requires more resources but provides additional information on prescribing practices, which is important for guiding antimicrobial stewardship activities.
AMU data centres on monitoring antibiotic use, typically using a metric involving a measured mass of antimicrobials, e.g. milligram (mg), gram (g) or kilogram (kg) of antimicrobials used in the human or animal sector. A raw total of ‘kg of antibiotics’ is therefore a simple and widely used AMU metric, usually with information regarding the indication (e.g. prophylaxis, treatment, etc).
Antimicrobial consumption, or AMC, is defined in terms of the ‘sale’ of antimicrobial medicines. This ‘sale’ of antimicrobials is captured by way of national-level estimates of the quantities of antimicrobials imported and manufactured (and then sold to distributors) in a country. These estimates of antimicrobial ‘sale’ data are mainly derived from import, sales or reimbursement databases. Such data are usually more accessible and can serve as a proxy for the actual use of antibiotics, for which data collection is often more laborious.
AMC data is typically expressed in terms of a
An example of a system which captures this type of AMC data in human health is the
- antibacterials for systemic use
- antimycotics for systemic use
- antimycobacterials
- antivirals for systemic use.
The resulting data are expressed as a number of DDD per 1000 inhabitants per day. AMC DDD data then permit comparisons to be made across local, national and global settings on trends in antimicrobial consumption over time, providing evidence of the impact of educational or regulatory interventions. See the Fundamentals of data for AMR course for more information, specifically the section on ‘drug utilisation methodology’.
An example of a system that captures data on antimicrobials for use in animals is the ANIMUSE system designed and used by the WOAH. Annually, the WOAH invites its members to submit data on the quantities of antimicrobial agents intended for use in animals, using a specifically designed tool. While some countries have advanced systems in place to report sales data at the prescribers’ level, most countries are only able to report sales data at wholesalers’ level and/or import data as declared by custom authorities.
The data collected on quantities of antimicrobial agents used in animals in a country is analysed at WOAH central level alongside the corresponding biomass of the animals present in country according to international databases held by the WOAH and the FAO, (mg – quantity of antimicrobials used/kg – animal biomass). This allows for comparisons across WOAH regions, and for trends in usage of antimicrobials over time to be understood. Section 8.1 discusses the WOAH tool in further detail (WOAH, 2024).
3 An introduction to AMR surveillance: local, national and global systems
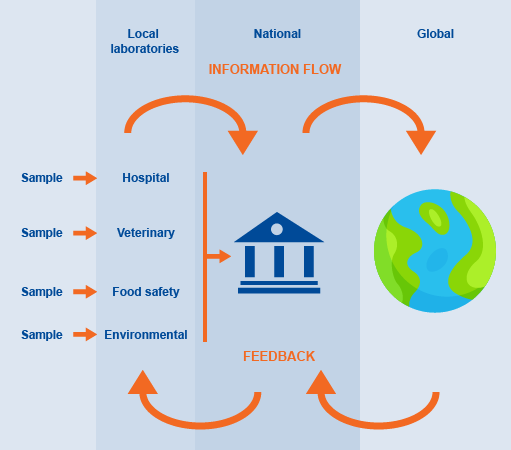
AMR data are collected at local, national and global levels and provide information on local, national, regional and global trends. Figure 4 illustrates how AMR data (which can include hospital patient samples, veterinary samples, animal product samples for food safety or environmental samples) might flow between these three levels, and where the feedback, typically comprising appropriately summarised information, should occur. Depending on the surveillance results there may also be some strategic interventions that are fed back from the national or global levels to the local levels.
Although progress in developing national and global surveillance systems is greatest in the human (healthcare) sector, it is important to remember that AMR-related surveillance systems are being developed and implemented in other sectors, as you learned in Section 2.3.
In the following sections you will look at some of the features of local, national and global surveillance systems.
4 Local surveillance systems
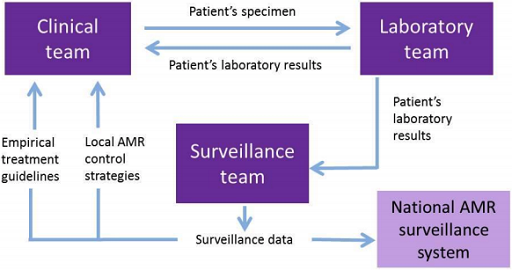
Local surveillance is the cornerstone of all AMR surveillance networks. Data collected by local surveillance sites are used to inform local decision-making and can also be reported centrally to a national system to provide a national overview of AMR. How surveillance is carried out can vary widely, but Figure 5 (Seale et al., 2017) is a good representation of how such systems look at a local level, and how they link into national systems.
In order to ensure consistent results across different surveillance sites or sectors participating in the surveillance network, it is important that standard procedures are used in each of these steps. If different methods or standards of testing are used in different local laboratories then the results cannot be easily compared or interpreted alongside one another. You will look in more detail at the importance of standardisation and quality assurance in the Quality assurance and AMR surveillance course. The importance of standardisation and quality assurance in how the data are managed, analysed, reported and interpreted are covered in depth in the Fundamentals of data for AMR and Processing and analysing AMR data courses.
4.1 Local surveillance systems in practice: patient care and surveillance
Laboratory teams working in microbiology laboratories regularly perform bacterial identification and antimicrobial susceptibility tests on samples collected by the clinical team (nurses, doctors, veterinarians) or animal owners, to provide information that can be used to treat the patient (human or animal). However, in many low and middle-income settings, bacterial identification and
To try to improve clinical care, laboratory capacity and AMR surveillance, a small number of laboratories may be specially supported in their microbiology capacity. Information obtained for clinical care can be collated and used as (passive) surveillance data, analysed and reported on by local surveillance teams and finally fed into a national AMR surveillance system, as detailed in Figure 6.
Now that you have looked at some aspects of local surveillance it is time to think about how this applies to your work by completing Activity 3.
Activity 3: the AMR surveillance process in your workplace
Part 2
Figure 7 is an example of a local surveillance system.
Try to match each example action/activity listed below to the aspect of local surveillance (included on the figure) that it most closely relates to.
Two lists follow, match one item from the first with one item from the second. Each item can only be matched once. There are 5 items in each list.
Laboratory team
Surveillance team
Clinical team
Surveillance data
National surveillance system
Match each of the previous list items with an item from the following list:
a.Receiving a sample and the action of performing identification and a susceptibility testing according to standard methods
b.A team responsible for data collection gives a report to a hospital committee about the use of antibiotics in the hospital
c.A team collates and analyses data to guide public health policy on AMR
d.A patient with a suspected infection is seen and an appropriate sample is taken for further investigation
e.Data are formatted and standardised according to set guidelines for submission
- 1 = a,
- 2 = b,
- 3 = d,
- 4 = e,
- 5 = c
5 National and multinational surveillance systems
Many countries now collate local AMR, AMU and AMC surveillance data to provide either a regional or national overview of AMR, AMU and AMC trends that can inform policy and health interventions.
5.1 National surveillance systems
Let us begin with looking at examples of national surveillance systems.
PHE’s Fingertips
ISIS-AR
The
The system accepts antimicrobial susceptibility (AST) data from all specimens sampled by medical laboratories, either for diagnostic reasons to treat patients presenting with signs of clinical infection or where routinely collected from patients who are at high risk of developing resistant infections. The data collected support policymaking in public health and healthcare, including the development of empiric antibiotic treatment guidelines. Analyses done via data from this platform helps facilitate scientific research, and contributes to quality, safety and the reduction of healthcare costs.
DANMAP
The
All antimicrobials prescribed in Denmark, in both the animal and human sectors, are recorded in nationally maintained databases. DANMAP utilises this central resource and reports on antimicrobial use and resistance with a focus on key bacterial species such as Escherichia coli, Campylobacter spp., Salmonella spp., Enterococcus spp., as examples from the animal sector, and Escherichia coli, Pseudomonas aeruginosa, Acinetobacter species, Enterococcus faecium and Enterococcus faecalis as human health sector examples.
5.2 Multinational surveillance systems
Now that you have looked at two systems which operate at national level, let’s consider two examples of multinational systems which operate across several nations. You will then look at the WHO’s GLASS programme, a standardised international programme for collecting AMR data and provides guidance on how to set up a national surveillance system which can submit data to its international platform.
EARS-NET
The
EARS-NET relies on individual countries submitting data in a standard format to an intermediary system:
EARS-NET requires member countries to submit information on antimicrobial susceptibility results for the following bacterial pathogens commonly causing infections in humans:
- Escherichia coli
- Klebsiella pneumoniae
- Pseudomonas aeruginosa
- Acinetobacter species
- Streptococcus pneumoniae
- Staphylococcus aureus
- Enterococcus faecalis
- Enterococcus faecium.
It should be noted that these are certainly not the only bacteria that cause infections – there are many others – however, these were chosen by the people setting up the EARS-NET system as being particularly relevant for the problem of AMR in Europe at this time. No AMR surveillance system can monitor all forms of resistance in all different bacteria – there are simply too many possibilities, so strategic choices must be made.
ReLAVRA
The
Like EARS-NET, ReLAVRA’s aim is to inform national policies via the systematic and reliable collection of AMR data. When it was established its initial scope was limited to reporting AMR data for just three pathogens (Salmonella spp., Shigella spp. and V. cholerae). By 2000 its scope had expanded to include several predominantly hospital-associated pathogens (Escherichia coli, Staphylococcus aureus, Acinetobacter baumannii, Klebsiella spp., Pseudomonas aeruginosa, Enterobacteriales and Enterococcus spp.) and three further community-acquired pathogens (S. pneumoniae, N. meningitidis and Haemophilus influenzae) in addition to Salmonella spp. and Shigella spp.
ReLAVRA is the world’s oldest AMR surveillance network, constituting 19 countries reporting AMR data via 750 laboratories.
Which pathogens are included in the ReLAVRA AMR surveillance network but are not included in the EARS-NET surveillance network? Why do you think there are these differences?
Examples of pathogens included in ReLAVRA but not in EARS-NET are as follows:
- V. cholerae, as there are virtually no cases in Europe, so no need to include in the surveillance programme.
- Shigella spp., which does occur in Europe but does not often cause severe illness, so is less of a priority for surveillance, as resistance patterns are probably very similar to E. coli, to which it is very closely related.
- Both pathogens N. meningitidis and H.influenzae are rare in Europe as there have been successful vaccination programs against major strains.
In some countries these organiams are covered under other surveillance systems (e.g. looking at vaccine coverage and efficacy).
5.3 Setting up national surveillance systems – the WHO’s GLASS
Obtaining reliable, accurate national data requires standardised approaches to sample collection, transport, storage, analysis and reporting at local sites. Similarly, national data must be reliable and comparable if they are to be integrated into regional or global surveillance reports, and examples such as EARS-NET and ReLAVRA are testament to this commitment.
To support international AMR surveillance, the WHO has developed the
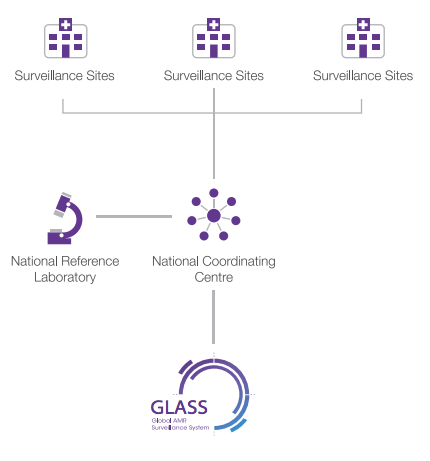
According to GLASS, a national surveillance system should comprise three core components (WHO, 2020) (Figure 8):
- a national coordinating centre
- a national reference laboratory
- selected AMR surveillance sites.
In addition to the core components, GLASS prompts national coordinating sites to standardise their reporting of antibiotic susceptibility testing (AST) data in line with internationally recognised standards – either the
From your study of earlier sections suggest some of the likely pathogens of interest.
- Escherichia coli
- Staphylococcus aureus
- Acinetobacter baumannii
- Klebsiella spp.
- Pseudomonas aeruginosa
- Enterobacteriales
- Enterococcus spp.
- Klebsiella pneumoniae
- Acinetobacter species
- Streptococcus pneumoniae
- Staphylococcus aureus
- Salmonella spp.
- Shigella spp.
- Vibrio cholerae
- Streptococcus pneumoniae
- Neisseria meningitidis
- Haemophilus influenzae
5.4 Core surveillance system components as outlined by GLASS
For the rest of this section you will look at each of these core components of a national AMR surveillance system. Currently GLASS is focused on the surveillance of priority bacterial pathogens relating to human health (GLASS-AMR), although it is, over time, expanding into AMU and One Health surveillance.
Surveillance sites collect clinical, microbiological and demographic data from patients. These are usually hospitals or out-patient health facilities with access to relevant laboratory support. There is no fixed number of surveillance sites that is needed for a National AMR surveillance system; there could be as few as one site, which might be appropriate in a small nation or if very limited funds are available. There could be 5 or 10 or 50 surveillance sites, depending on the size and diversity of the country and the resources available for running the surveillance program. There is no need for every hospital in the country to be contributing data to the AMR surveillance system – this is unlikely to be practically possible anyway.- The primary function of a
national reference laboratory is to promote good microbiology laboratory practice by compiling and disseminating standard methods to surveillance sites. It may also perform confirmatory testing and support surveillance sites by providing training. Different sectors may have their own national reference laboratories; for example in the UK, where this course was written, the national reference laboratory for healthcare-associated bacteria is the AMR and Healthcare Associated Infections (AMRHAI) laboratory, while the National Reference Laboratory for Food Microbiology monitors AMR in the food chain. - The
national coordinating centre (NCC) establishes and oversees the WHO’s Glass national surveillance system. It gathers AMR data from the surveillance sites and national reference laboratories and communicates this information to national policymakers and global surveillance systems. In many countries this is one of the roles of the AMR coordinating committee (AMRCC).
An example of a country utilising this approach in the animal health sector is Canada. AMC surveillance in animal health is accomplished through the mandatory reporting of antimicrobial sales data from members of the Canadian Animal Health Institute (CAHI), the trade association representing manufacturers and distributors of veterinary pharmaceuticals in Canada. The
Activity 4: National AMR surveillance systems in your country
In this activity you will be using data from GLASS which is available on the WHO website.
If your country is enrolled with GLASS and has a national AMR surveillance system for human health, you should be able see your GLASS country profile (WHO, 2021) by selecting it from the ‘Select Country’ drop-down menu on the right-hand side of the dashboard. Don’t worry if your country does not appear – try to find the country that is nearest to yours in size and income level for comparison.
You should now be viewing the current status of the AMR surveillance network in your country. How many surveillance sites are there in your country? Record what you find out in the space below; you may want to take a screenshot of the page to do this. You might like to explore how the surveillance network in your country compares to other countries enrolled in GLASS (but don’t worry if your country isn’t enrolled in GLASS).
In many countries, possibly including your own, national surveillance systems were being developed and implemented at the time of updating this course in 2025. However, these countries often have a
There is a library of NAPs on the WHO website. Can you find a NAP for antimicrobial resistance for your country? What does your NAP say about AMR surveillance? Record what you find out in the space below. Note that we don’t expect you to read your country’s whole NAP for these courses – try using the search function on your computer or look at the contents list of the report to find the information you need.
6 Global surveillance systems
Global surveillance programmes that monitor antibiotic resistance in specific bacterial pathogens, such as Mycobacterium tuberculosis (Zignol et al., 2016) and Neisseria gonorrhoeae (Wi et al., 2017) have been in place for many years. However, significant gaps remain in the surveillance of many other important bacterial pathogens that cause infections in humans. Addressing this problem and developing common standards for data collection, analysis and sharing at local, national, regional and global levels led to the establishment of the WHO’s GLASS platform in 2015.
As you may recall, the Global Action Plan on AMR recommends that a One Health approach be applied to AMR surveillance (WHO, 2015). GLASS has been designed to progressively incorporate AMR surveillance data, including AMR in the food chain and the environment. GLASS includes a One Health technical module that offers an integrated multi-sector surveillance programme based on the extended-spectrum beta-lactamase (ESBL)-Escherichia coli (‘Tricycle’) project. The Tricycle project was developed by the WHO and the WHO Advisory Group on Integrated Surveillance of Antimicrobial Resistance (AGISAR) in close collaboration with the FAO and the WOAH to promote the development of harmonised surveillance across different sectors in order to inform public health, animal health and global food security.
The goal of GLASS is to enable standardised, comparable and validated data on AMR to be collected, analysed and shared with countries, in order to inform decision-making, drive local, national and regional action, and provide the evidence base for action and advocacy (WHO, 2020).
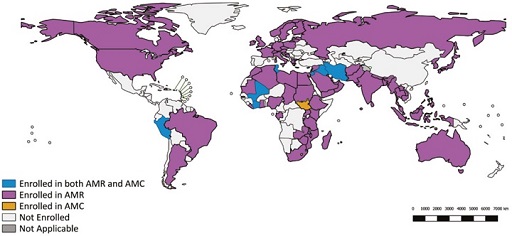
As of October 2024, 140 countries were enrolled in GLASS (Figure 9). Enrolment does not necessarily mean that the countries have provided AMR data to GLASS, but it does confirm the country is in the process of developing a national AMR surveillance system. Countries who enrol in GLASS are expected to nominate a
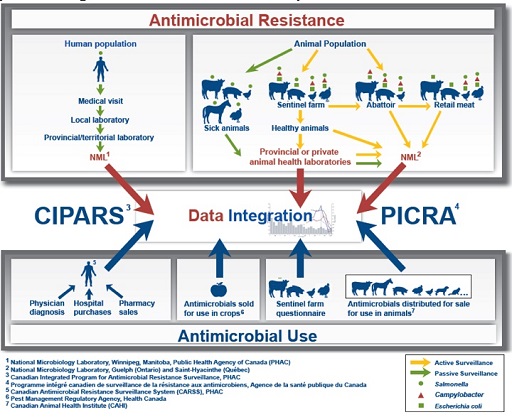
7 Integrated national surveillance platforms: CIPARS
You have looked at local, national (including multinational) and global surveillance systems, so it is now time to discuss integrated systems.
Integrated systems aim to collect, analyse, and communicate trends in AMU and AMR for selected bacteria from different sectors. Information from these integrated systems supports measures to contain the emergence and spread of resistant bacteria among animals, food and people, with the aim of prolonging the effectiveness of antimicrobials. One example of a comprehensive, national, integrated One Health AMR and AMU surveillance system is the
CIPARS monitors the trends in AMU of all antimicrobial agents and AMR in selected bacteria in humans, animals and food sources from all over Canada. Figure 10 shows the composition of the CIPARS surveillance approach. It is important to note that the CIPARS system shares similarities with EARS-NET and ReLAVRA in the key system components it relies on, e.g. sentinel sites, reference laboratories and epidemiology units in charge of collating, analysing and interpreting data. You may like to read the executive summary of a report on CIPARS from 2022 to learn more about this system.
At this point it is worth noting that AMR surveillance in animals can serve different purposes, depending on whether the end goal is to secure animal and/or human health, and its design (i.e. area surveyed, microbe – antimicrobial (or ‘bug-drug’) combinations and choice of standards) should be adapted accordingly – such considerations are covered in more depth in the AMR surveillance in animals and the Introducing a One Health approach to AMR courses.
Provision of data to an integrated surveillance system is made possible using standardised collection and testing procedures to ensure that results from different studies can be compared and contrasted. In this way trends in AMR, AMU and AMC in each sector and between sectors can be investigated. This allows for effective measures to reduce the emergence and spread of resistant organisms between people, animals, agricultural and animal produce to be developed.
Activity 5: Identifying pathogens
a.
Salmonella spp.
b.
Shigella spp.
c.
S. pneumoniae
d.
N. meningitidis
e.
Campylobacter spp.
f.
Haemophilus influenzae
g.
Escherichia coli.
The correct answers are a, e and g.
8 Surveillance methods and design
In this section you will first look at the data that is collected by surveillance systems before moving on to see how the data are reported.
8.1 Data collected by surveillance networks
Data reported to surveillance systems should be based around:
- what the surveillance system is designed to do
- guidelines set out by the WHO, WOAH, FAO, or global surveillance networks
- the types of infection that are present in the setting or country where the data is being collected
- which types of samples can be collected, for example, blood, faeces, or swabs from patients or equipment.
AMR surveillance is usually limited to a number of priority pathogen-antimicrobial (bug-drug) combinations. Section 5 gave details on the data required for some surveillance systems such as EARS-NET, ReLAVRA and GLASS. It is not possible to monitor all forms of resistance in all microbes continuously, so any surveillance system must make a pragmatic choice about the highest priority and the easiest organisms to collect AMR data on.
As discussed above, data collected by surveillance networks are not restricted to antimicrobial susceptibility and resistance data: data on antibiotic usage and consumption can also be collected in the same systems. The choice of what data to collect depends on the purpose of the system. Clinical, patient demographic and epidemiological information often accompany AMR/C/U data and provide crucial contextual information, which is vital to interventions or decisions made as a result of communicating these data.
In local surveillance networks, this contextual data might include:
- the patient’s date of birth and gender
- the type of specimen
- the patient’s diagnosis
- any antimicrobial therapy that has already been given
- whether the infection was hospital- or community- acquired.
Patient information is important because it helps to inform practical guidelines for antimicrobial use. For example, if a particular organism is most commonly found in samples taken from outpatient clinics to treat a human health condition, then the treatment guidelines for this type of infection in this setting could be revised in light of the AMR levels detected by the surveillance system.
Data must be collated and reported in a format that can be readily used, for example to determine antimicrobial susceptibility and resistance patterns across multiple bug-drug combinations, or to compare antibiotic use in animals between different countries or over time. You will now look at data submitted via the WOAH tool and go through a specific example which highlights the need for complete, context-rich data.
An example: data reported via the WOAH tool
As discussed in Section 2.3, the WOAH has established the ANIMUSE databse, which is a worldwide database that monitors quantities of antimicrobials intended for use in animals. In 2021, data to the WOAH was submitted by 152 countries (WOAH, 2024), as shown in Table 1. (You can explore the ANIMUSE report further.)
| WOAH region | Number of countries that submitted reports | Number of WOAH members Footnotes 1 | Proportion of response (%) |
|---|---|---|---|
| Africa | 44 | 54 | 81 |
| Americas | 23 | 31 | 74 |
| Asia, Far East and Oceania | 28 | 32 | 88 |
| Europe | 46 | 53 | 87 |
| Middle East | 11 | 12 | 92 |
| Total | 152 | 182 | 422 |
Footnotes
Footnotes 1 Distribution of countries by WOAH region is done according to the WOAH Note de Service 2010/22 – Annex 9 Back to main textCan you recall what variable AMU data is adjusted by to provide a rate, e.g. by country, allowing for comparisions between countries and regions?
AMU data are often adjusted for animal biomass.
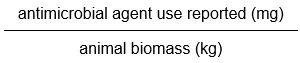
Meaningful comparisons need to be made between antimicrobial reports intended for use in animals and those which take into account total animal populations (which vary yearly and between countries and regions). A calculation known as ‘animal biomass’ enables these comparisons to be made, and this is calculated as the total weight of live animals in a given population, country and year. Animal biomass is used as a proxy measure for animals likely to be exposed to antimicrobials. The approach to calculating animal biomass varies between species and is not covered in this course. Antimicrobial use is adjusted for animal biomass according to the following calculation:
AMU data that has been adjusted by animal biomass allows for patterns to be analysed (Figure 11).
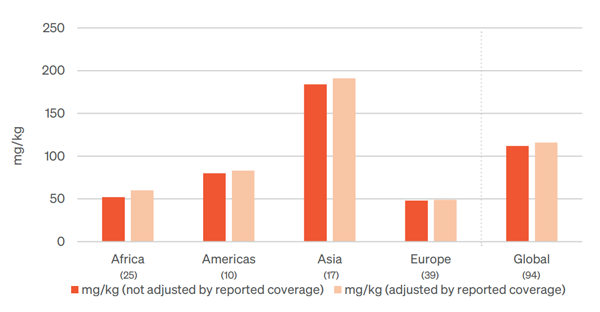
From Figure 11, how does the quantity of antimicrobial agents figure for ‘Asia’ compare to that of Europe?
The quantity of antimicrobial agents figure for Asia is higher than that of Europe.
By what factor does the quantity of antimicrobial agents figure for Asia exceed that of Africa?
By approximately a factor of 4.
What factors might explain the differences in these figures for the quantity of antimicrobial agents, between regions?
Socio-economic, geographical, predominant method of animal husbandry are some of the factors that could explain the differences.
8.2 Surveillance system design
Finally for this course, you will learn about the design of surveillance systems using some examples.
In an
An example of an active surveillance methodology used in the animal sector to help monitor rates of resistance, is the work undertaken by the European Antimicrobial Susceptibility Surveillance in Animals (EASSA). The potential for transmission of antimicrobial resistant bacteria from food-producing animals to humans via contaminated food is a serious public health concern. The EASSA programme collects bacterial isolates using standard and uniform methods from healthy food-producing animals, focusing on bacterial species such as Salmonella and Campylobacter spp. as well as commensal Escherichia coli and Enterococcus spp. Slaughterhouses from countries which participate in the programme are purposefully chosen based on animal throughput, with samples sent to a central laboratory for antimicrobial susceptibility testing. The results derived help illustrate the scope of antimicrobial resistance in the food-producing animal sector (De Jong, 2013).
A
An example of passive surveillance systems in the animal sector is the work done by the Canadian Integrated Program for Antimicrobial Resistance Surveillance (CIPARS) in Canada. CIPARS relies partially on diagnostic samples submitted routinely by producers to local animal health laboratories, which are then submitted to a central laboratory for further analysis. A particular focus is Salmonella, with continual analysis through passive surveillance allowing for trends in resistance within this bacterial species to be observed over time.
Passive surveillance systems are often (though not always) less time-consuming and less expensive than active surveillance systems. However, active surveillance systems typically allow more comprehensive data gathering, i.e. data gathered against a larger number of variables, targeted to answer a specific question from a representative sample, than passive surveillance, but at a greater cost. Most national AMR surveillance systems in high-income countries are based around a passive surveillance system.
Lastly let us look at a
The WHO’s GLASS AMR programme supports a sentinel site approach, particularly for low and middle-income countries where it is neither feasible nor necessary, to collect data from every healthcare facility. Countries focus their efforts on collecting good quality data from a selection of sites chosen to represent different levels of healthcare and reasonable population coverage, making establishing a surveillance system more affordable and achievable. Further sites can be added to the system at any stage, providing they meet the data quality requirements.
A
Activity 6: The surveillance system in your country and context
Find out which types of surveillance systems you have in your country and sector. Are they active or passive, or part of a sentinel surveillance system or point prevalence survey? You may want to consider particular activities that you engage with at your workplace that fit with the descriptions in the section above. You may also want to discuss this with the lab manager or your supervisor.
Activity 7: Self-assessment
a.
Active surveillance system
b.
Sentinel surveillance system
c.
Passive surveillance system
d.
All of the above
e.
None of the above
The correct answer is d.
An
Note that if antibiograms are being used to summarise across a collection of bacteria then we ought to ensure:
- isolates belong to the same species
- the method by which the isolates are collected is similar or comparable
- that the analysis includes a minimum of ten isolates in order for the final analysis to be meaningful.
Antibiograms can be used to track resistance trends and compare susceptibility rates between different hospital departments, healthcare facilities, farms, regions or countries. Antibiograms can also be used by clinicians and veterinarians to guide treatment decisions.
Activity 8: Analysing AMR susceptibility data
Part 1
Figure 13 shows an example of an antibiogram. The first column lists the organisms that were included. The second column shows the number of isolates of that organism that were tested and included in the antibiogram. As a rule of thumb, to make general statements about patterns of antibiotic resistance you should have at least ten bacterial isolates of a particular species – but the more, the better. The remaining columns show the antimicrobials that were tested. The values show the percentage of organisms susceptible to each antibiotic.
Some antibiograms are colour-coded to reflect their general patterns of resistance. Bug-drug combinations that are mainly susceptible are coloured green, whereas combinations that are predominantly resistant are coloured red. Intermediate levels of resistance are coloured yellow. These results reflect many individual susceptibility tests, which are determined using standardised susceptibility testing methods as described in the Antimicrobial susceptibility testing course.
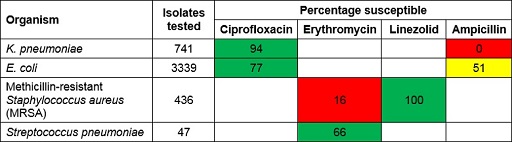
Study Figure 13 and use it to answer the following questions:
- Which Gram-negative organisms are included?
Answer
K. pneumoniae and E. coli.
- What percentage of E. coli isolates are susceptible to ampicillin?
Answer
51%.
- Which pathogen-antimicrobial combinations show high levels of resistance?
Answer
K. pneumoniae-ampicillin and MRSA-erythromycin. K. pneumonia is intrinsically resistant to ampicillin so this result is expected. However, the antibiogram also indicates that infections due to MRSA are highly likely to be resistant to erythromycin, and that nearly half of the infections due to E. coli are also likely to be resistant to ampicillin.
Part 2
Does your workplace use antibiograms to report cumulative antimicrobial susceptibility data?
If you have access to an antibiogram from your workplace, you should use it for the rest of this activity. If you do not have access to an antibiogram from your workplace, use the interactive antibiogram tool provided by Stanford University to select three organisms and three antimicrobials, and generate your own antibiogram. Note that data are not available for all combinations of pathogens and antimicrobials.
Once you have your antibiogram, make a note of any bug-drug combinations where resistance is reported and consider the following points:
- Which levels of susceptibility/resistance would you colour code red, yellow, green?
- How would you explain to a clinician what a 25% susceptible rate means? Does it mean the antibiotic will work 25% as well as if there was no antibiotic resistance?
- What are the likely local effects on an antibiogram of different stewardship activities (eg increased/decreased local use of particular antibiotic)? What period of time might it take for changes to be seen?
Please add your thoughts and reflections to your reflective blog, and discuss them with your colleagues to see what they would say.
9 End-of-course quiz
Well done – you have reached the end of this course and can now do the quiz to test your learning.
This quiz is an opportunity for you to reflect on what you have learned rather than a test, and you can revisit it as many times as you like.
Open the quiz in a new tab or window by holding down ‘Ctrl’ (or ‘Cmd’ on a Mac) when you click on the link.
10 Summary
In this course you have learned how a quality management system underpins the operational efficiency of a laboratory, and the internal and external checks that guarantee AMR data quality and integrity. You have also been introduced to the idea of accreditation for laboratories as a way of ensuring that quality standards are maintained.
You should now be able to:
- describe the objectives and requirements of AMR surveillance systems
- describe the One Health approach to AMR surveillance
- outline the differences between AMR, AMU and AMC surveillance
- describe the types of data collected by surveillance networks
- provide examples of AMR surveillance systems in humans and animals
- outline the importance of and relationships between local, national and global AMR surveillance networks and systems
- explain integrated surveillance systems, providing examples
- identify local and national surveillance networks or systems relevant to your work context
- describe how surveillance systems can be designed.
Now that you have completed this course, consider the following questions:
- What is the single most important lesson that you have taken away from this course?
- How relevant is it to your work?
- Can you suggest ways in which this new knowledge can benefit your practice?
When you have reflected on these, go to your reflective blog and note down your thoughts.
Activity 9: Reflecting on your progress
Do you remember at the beginning of this course you were asked to take a moment to think about these learning outcomes and how confident you felt about your knowledge and skills in these areas?
Now that you have completed this course, take some time to reflect on your progress and use the interactive tool to rate your confidence in these areas using the following scale:
- 5 Very confident
- 4 Confident
- 3 Neither confident nor not confident
- 2 Not very confident
- 1 Not at all confident
Try to use the full range of ratings shown above to rate yourself:
When you have reflected on your answers and your progress on this course, go to your reflective blog and note down your thoughts.
11 Your experience of this course
You’ve now reached the end of this course. If you’ve enrolled on a pathway, please go back to the pathway page and tick the box to confirm that you’ve completed this course. On the pathway page you’ll see both your progress so far as well as the other courses you need to complete in order to achieve your Certificate of Completion for that pathway.
Now that you have completed this course, take a few moments to reflect on your experience of working through it. Please complete a survey to tell us about your reflections. Your responses will allow us to gauge how useful you have found this course and how effectively you have engaged with the content. We will also use your feedback on this pathway to better inform the design of future online experiences for our learners.
Many thanks for your help.
References
Acknowledgements
This free course was collaboratively written by Kay Saunders, Siddharth Mookerjee and Patrick Murphy, and reviewed by Alexander Aiken, Emma Zalcman, Melanie Bannister-Tyrrell, Claire Gordon, Natalie Moyen, Ben Amos, Rachel McMullan and Hilary MacQueen. The course was reviewed and updated by Priya Khanna, Hilary MacQueen, Clare Sansom and Rachel McMullan in 2025.
Except for third party materials and otherwise stated (see terms and conditions), this content is made available under a Creative Commons Attribution-NonCommercial-ShareAlike 4.0 Licence.
The material acknowledged below is Proprietary and used under licence (not subject to Creative Commons Licence). Grateful acknowledgement is made to the following sources for permission to reproduce material in this free course:
Course image: andreus/123RF.
Figure 1: from Antimicrobial Resistance: Tackling a Crisis for the Health and Wealth of Nations, 2014. This file is licensed under a Creative Commons Attribution 4.0 International (CC BY 4.0) licence, https://creativecommons.org/ licenses/ by/ 4.0/.
Figure 2: Review on Antimicrobial Resistance, ‘How surveillance can improve health outcomes’, https://amr-review.org/ infographics.html. This file is licensed under a Creative Commons Attribution 4.0 International (CC BY 4.0) licence, https://creativecommons.org/ licenses/ by/ 4.0/.
Figure 3: Government of Canada, ‘Epidemiology of antimicrobial resistance’, published at https://www.canada.ca/ en/ public-health/ services/ surveillance/ canadian-integrated-program-antimicrobial-resistance-surveillance-cipars/ background.html.
Figures 4 and 5: The Open University.
Figures 6 and 7: reproduced from Diagnostic Stewardship: A Guide to Implementation in Antimicorbial Resistance Surveillance Sites, copyright 2016 World Health Organization. Available online at https://apps.who.int/ iris/ bitstream/ handle/ 10665/ 251553/ WHO-DGO-AMR-2016.3-eng.pdf?sequence=1.
Figures 8 and 12: reproduced from ‘National antimicrobial resistance surveillance systems and participation in the Global Antimicrobial Resistance Surveillance System (GLASS)’, copyright 2016 World Health Organization. Available online at https://apps.who.int/ iris/ bitstream/ handle/ 10665/ 251554/ WHO-DGO-AMR-2016.4-eng.pdf?sequence=1&isAllowed=y.
Figure 9: World Health Organization.
Figure 10: © All rights reserved. Canadian Integrated Program for Antimicrobial Resistance Surveillance (CIPARS) 2016 Annual Report, Public Health Agency of Canada, 2016. Adapted and reproduced with permission from the Minister of Health, 2021.
Figure 11: World Organisation for Animal Health (WOAH).
Figure 13: Fleming Fund.
Table 1: World Organisation for Animal Health (OIE) (2020) OIE Annual Report on Antimicrobial Agents Intended for Use in Animals: Better Understanding of the Global Situation, fourth report, Paris: OIE, p. 22, Table 1. Available at https://www.oie.int/ fileadmin/ Home/ eng/ Our_scientific_expertise/ docs/ pdf/ A_Fourth_Annual_Report_AMU.pdf (accessed 25 January 2021).
Every effort has been made to contact copyright owners. If any have been inadvertently overlooked, the publishers will be pleased to make the necessary arrangements at the first opportunity.