Use 'Print preview' to check the number of pages and printer settings.
Print functionality varies between browsers.
Printable page generated Wednesday, 22 July 2026, 11:16 PM
Health Management, Ethics and Research Module: 11. Developing Your Community Profile
Study Session 11 Developing Your Community Profile
Introduction
In Study Session 10, you were introduced to the community survey, which is the data collection tool you will make use of in developing your community profile.
The community profile is essential in producing evidence-based information for planning, implementation and evaluation of health programmes in your catchment area. It can also be a basis for suggesting further small-scale research into local health problems and their possible solutions.
As a Health Extension Practitioner you need to have the knowledge and skill to develop a community profile, which will enable you to identify important health-related factors in your community. You are also expected to update and develop further the kebele-level community profile at regular intervals after your deployment to the Health Post. This is what the following study session will teach you to do, besides helping you understand the basic terminologies related to different data types used in developing your community profile.
Learning Outcomes for Study Session 11
When you have studied this session, you should be able to:
11.1 Define and use correctly all of the key words printed in bold. (SAQ 11.1)
11.2 Describe the main features and purposes of a community profile. (SAQ 11.4)
11.3 Describe the different types of data that you may use in developing or updating your community profile. (SAQs 11.1, 11.2, 11.3 and 11.4)
11.1 What is a community profile?
A community profile is the analysed and reported results of the data collected by a community survey, which describes a combined picture or profile of the population in your community. It may include such features as:
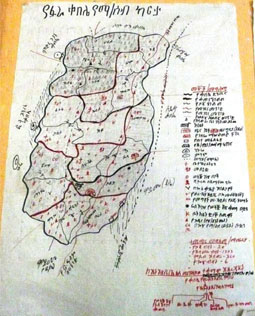
- kebele boundaries (Figure 11.1)
- the numbers of people and households
- the ages and genders of the population
- birth and death rates
- income and socioeconomic advantage/disadvantage data
- social/community needs
- access to services (e.g. health, education, water supply)
- knowledge, attitudes and beliefs on important health topics affecting the population.
Think back to Study Session 10. In order to generate a community profile, will the community survey collect quantitative data, qualitative data or both? Explain your answer.
It will collect both types of data: quantitative data (counts) of the number of households, people, ages, genders, education level, etc., and qualitative data on people’s knowledge, attitudes and beliefs on health issues and other related topics.
11.2 What is the purpose of the community profile?
The purpose of developing your community profile at the Health Post level is to collect baseline data for understanding health and health-related problems in your community. Baseline data means the data that is collected at the start of any programme or intervention that can later be used for comparison to assess what has changed. The baseline data will help you in the planning, implementation and evaluation of your health programmes. It may also help you in identifying problems that could be further investigated and addressed through small-scale research projects.
In your profile, the community may be summarised by population numbers and distribution, income, age, or education level. If the surveys are repeated at intervals it can tell you whether the population is increasing or declining in numbers.
Can you suggest some reasons why the population of a kebele might be rising, and some reasons why it might be falling?
The population might be rising because more babies are being born than in the past (i.e. the birth rate is increasing), and more babies and young children are surviving (i.e. the under-five child mortality rate is falling); it might also be rising due to migration of people into the kebele. The population might be falling for the opposite reasons: if fewer babies are born (e.g. due to greater use of family planning), or more of the babies and young children are dying, or people are leaving the kebele to live elsewhere.
The data in the community profile should give you an accurate picture of what is happening within the kebele at that point in time. The profile is expected to show the economic condition of the kebele. Health and educational resources may also be documented to reflect the availability of these services to the kebele population. For example, if there is a limited preventive or curative service, how are the people going to get healthcare? The profile may also shed light on a wide range of issues such as:
- Are there any free or low-cost health facilities for drought-prone areas?
- Are there graduates of model households who can teach other families how to promote their health and prevent common diseases?
- Are there voluntary community health service providers who can be used more effectively?
- What percentage of the children has been fully immunized at one year old?
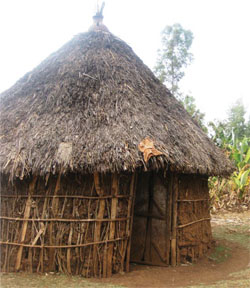
- The community profile may also highlight the status of the housing and the physical environment surrounding it (Figure 11.2).
- It may contain information on the status of public safety in the kebele (local crime, alcohol abuse, substance use, mental health problems, etc.).
In summary, the kebele community profile should show the direction in which the community is going and the important issues that are currently affecting the health of the population.
11.3 What types of data will you collect for a new community profile?
You will learn much more about data collection techniques and data analysis in Study Session 12. Here we will focus on what needs to be included in preparing your community profile at kebele level for planning, implementing and evaluating health programmes. We gave a general overview of the data in Section 11.2, but here we are going to discuss these data types in detail. The knowledge and skills you develop here will be expanded and reinforced in Study Sessions 12 to 15.
The types of data that we will describe in this study session are:
- Demographic data
- Epidemiological data
- Health service data
- Data on knowledge, attitudes and practice (also known as behavioural data)
- Data on physical characteristics in the environment.
11.3.1 Demographic data
Demography, which was introduced in Study Session 10, is the scientific study of characteristics and dynamics pertaining to the human population. These characteristics include births, deaths, age, income, education and gender. Other relevant characteristics include occupation, family size, housing, ethnicity, language and religion. As a Health Extension Practitioner you need to collect data on these characteristics. Demographic factors are among the easiest to measure and are the most widely used basis for subdividing population groups.
Some of the demographic data that you will collect and report in a community profile for the health system include the following.
Age distribution of the community
Data collection for the health system typically categorises the population of a country, region or local community into fixed age ranges in years as follows: 0–4, 5–9, 10–14, 15–19, 20–24, 25–29, 30–34, 35–39, 40–44, 45–49 and 50 years and above.
Using this type of classification, which age range data do you need at Health Post level to plan for immunization programmes to protect against vaccine-preventable diseases such as tuberculosis, measles and polio?
Children in the age range 0–1 year are the target group for these immunizations, which protect against some major childhood infections. You need to know how many children in the kebele are in this age range so you can plan your immunization service effectively, and without wasting vaccines by ordering too many vials.
Gender
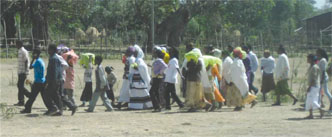
Gender is the term used to identify whether a person is male or female. Classification of the population in your kebele into the two genders is useful in your community profile because it enables you to plan for gender-specific services (Figure 11.3).
Can you think of any types of health service or health education that are focused mainly on one gender?
You may have thought of antenatal care, labour and delivery care, and postnatal services, which are provided for women. You may also have thought of health education programmes focused on educating men about the dangers of alcohol abuse or cigarette smoking, since these activities are rare among rural women.
Family size of the household
One reason for classifying households on the number of people living there is that it gives you some information on the type of health services they may need. For example, if the household has a large number of children, you may need to focus your health messages on advice about family planning to limit their family size. In developing countries like Ethiopia, limiting family size using contraceptives is one strategy to alleviate poverty, prevent sexually transmitted diseases, and reduce the risk of pregnancy-related deaths and under-five child mortality.
Can you think of any other reasons why knowing household size could be useful in organising the provision of healthcare?
If a household is overcrowded (too many people living in a small space), there is a greater risk of transmission of diarrhoeal and respiratory diseases through lack of hygiene, and close contact with anyone who is coughing or sneezing. If there are many mouths to feed, there is a greater risk of malnutrition affecting health, particularly among the children. Knowing which households are at greatest risk enables you to focus your home visits and use your time more efficiently.
Income
The health-promoting behaviour of people in your community can be affected by family income; for example, it affects the quality and quantity of the diet they can afford, and whether they have the money to build a latrine. Also, those with a good income can afford to seek health services if they are ill; poor families may not be able to afford the costs of transport to the health centre, or the charges for drugs or items such as surgical gloves.
Occupation
Collecting data on occupations in each household can give useful information about potential health risks and the likely needs for health services. Some occupations have direct impacts on health. For example, farmers and labourers are at higher risk of accidental injury from tools and heavy weights; people working at leather tanning are exposed to hazardous chemicals and possible infection from the hides. Don’t forget that the nature of your own work may put you at risk of health problems. For example, as a health professional, you are at risk of infection if you do not practise infection prevention techniques such as regular handwashing with soap, and using surgical gloves when dressing an infected wound or delivering a baby.
Religion
Some Christian churches will not support the use of condoms for family planning, or to prevent the transmission of HIV. This is one example of how a person’s religion can influence their health and demonstrates why recording the religion in a household is part of the community profile.
Educational status
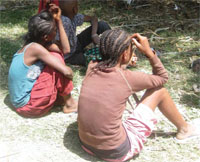
The educational attainment of girls is particularly important to record in the community profile for several reasons. Better education generally enables people to understand and accept health education messages; it can also lead to better employment and higher income. Female education is associated with improved survival rates of a woman’s children and increased uptake of family planning. It is also associated with delay in the age of marriage and therefore delay in the birth of the first child (Figure 11.4).
Can you suggest why delayed first birth is beneficial to the health of both the mother and the baby?
Very young girls can have difficulty giving birth because their bodies have not yet developed sufficiently; this poses a risk to them and to the baby. Delaying the first birth until the girl is older gives a better chance of survival for them both.
11.3.2 Epidemiological data
Epidemiology is the statistical study of the occurrence, distribution, potential causes and control of diseases and disabilities in human populations. The population under investigation could be the entire world, as in the case of a global influenza epidemic, or it could be a relatively small group of people – a single high school, for example, with an unusually high number of adolescents with asthma. Epidemiological data includes:
- counts of illnesses and disability (morbidity data)
- counts of deaths from specific causes (mortality data)
- risk factors for health problems (i.e. factors such as smoking or exposure to toxic waste that increase the likelihood of a disease or disability occurring)
- health promoting factors (e.g. balanced diet, physical activity).
All of these types of epidemiological data are useful for developing your community profile.
Why is it important to document morbidity?
While it is important to identify and prevent health problems that kill people, it is also important to address causes of illness and disability that occur in your community without leading to death. To get a complete view of problems facing you as a health service provider, both mortality and morbidity must be considered. Morbidity is far commoner than mortality. By studying morbidity, it is possible to get a better idea of the pattern of disease and its possible causes as well as identifying incorrect management of cases that result in mortality. In conditions where deaths are uncommon, it is particularly useful to study patterns of morbidity. The causes and avoidable factors of mortality and morbidity are usually the same.
11.3.3 Health service data
Health service data (as the name suggests) tells you what health services are available in the kebele and what use is made of these services by the population. For example, it counts the number of times each client is seen by a health worker, the reason for each visit, whether it was in a health facility or in the client’s home, and whether the resulting intervention was health advice and reassurance, or the supply of medical drugs or other services (e.g. contraception).
The purpose of collecting health service data is to identify strategies that improve the access of every member of the community to effective healthcare and health promotion. By collecting health service data on coverage you will be better able to understand:
- Do those individuals with healthcare needs get the necessary health interventions? For example, what access to malaria treatment drugs is available for patients who develop malaria?
- What determines the probability of an individual receiving a needed health intervention? Is it their age, their gender, their social circumstances, etc.?
- What are the barriers preventing the whole population receiving the required health services? Are the barriers mainly financial problems that prevent access to services, or is there a shortage of trained personnel, drugs or equipment?
- What specific health services are offered to the community and where are the gaps in services?
- What is the pattern of healthcare-seeking behaviour of the community? Healthcare-seeking behaviour describes how people interact with the health service and healthworkers. For example, people may be reluctant to seek help from the formal health service or they may be regularly seeking attention from health personnel.
What different types of health services are being sought by people in your community?
Some people may seek homemade remedies, such as herbs; others may seek indigenous health services (e.g. spiritual healing from a religious leader or a traditional healer); and some will seek help from the modern health service (at the Health Post, health centre or district hospital).
11.3.4 Data on knowledge, attitudes and practice (KAP)
Collecting data on the behaviour or practices of people in your community and on their knowledge, attitudes, beliefs or opinions about major public health problems can be useful in developing baseline data for health education and health promotion interventions. For example, knowledge of how local people think tuberculosis, HIV, sexually transmitted infections and diarrhoeal diseases are spread in the community will help you to focus your health education interventions on the areas of greatest ignorance or need.
Your community profile may also include data about your local environment such as:
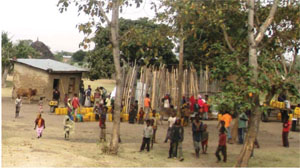
- the water points in the community (distribution centres) (Figure 11.5)
- the condition of the housing and the number of rooms per household
- the distribution of latrines
- the existence of water collections such as pools and marshy areas where mosquitoes can breed
- the transport links with the nearest health centre
- whether there is a telephone in the kebele office, or mobile phone network coverage, etc.
In the next study session, we look in greater detail at data collection methods for your community survey.
Summary of Study Session 11
In Study Session 11, you have learned that:
- The purpose of developing your community profile is to collect baseline data on health and health-related problems in your community, which helps you in the planning, implementation and evaluation of your health programmes.
- The data to be collected for your community profile include:
- kebele boundaries and locations of key services
- demographic data (number of people and households, ages and genders, birth and death rates, income and socioeconomic data)
- epidemiological data on morbidity and mortality rates from different causes
- social/community needs
- health service data on provision and access to health services
- local knowledge, attitudes and beliefs on important health topics
- behavioural data on patterns of use of health services
- environmental data affecting health locally.
- The purpose of collecting health service data is to identify strategies that improve the access of every member of the community to effective healthcare and health promotion.
- The questions that the community survey can help you to answer include whether individuals receive the necessary health interventions, what determines the probability of an individual receiving a needed health intervention, and what are the barriers preventing the whole population receiving the required health services.
Self-Assessment Questions (SAQs) for Study Session 11
Now that you have completed this study session, you can assess how well you have achieved its Learning Outcomes by answering these questions. Write your answers in your Study Diary and discuss them with your Tutor at the next Study Support Meeting. You can check your answers with the Notes on the Self-Assessment Questions at the end of this Module.
First read Case Study 11.1 and then answer the following questions.
Case study 11.1 A sanitary survey in Gondar town
A cross-sectional community-level study was conducted with the aim of assessing the environmental sanitation status of Gondar town. The researcher developed and used structured questionnaires to collect information. Among the visited households, 985 (65%) were in the high population density kebeles and 531 (35%) were in the low density kebeles. Respondents interviewed at the household level were 771 (51.9%) male and 745 (49.1%) female. Of the respondents, 868 (57.3%) were found to be literate and 772 (50.9%) of the households had latrines.
The researchers found that households with a higher educational level had a higher availability of latrines whereas households with a lower educational level had lower latrine availability. There was also a strong association between income and availability of latrines, i.e. those with a high income were more likely to have a latrine than those with a low income. 491 (32.4%) of the households had a monthly income of less than 110 Birr.
The average area of a housing unit was 34.96 square metres, with two rooms per housing unit, and an average occupancy of 5.20 persons per household. Only 758 (50%) of the households had a kitchen. Lack of space and high cost were among the reasons stated for not having a latrine. Of the households, 769 (50.7%) were disposing of their faeces (stools) in the open fields. Others used a private pit, or the kebele’s selected site and municipal collection containers. Of the respondents, a total of 1,432 (94%) washed their hands after passing stools or urine. Of these, 853 (59.6%) washed their hands without soap and 579 (40.4%) washed with soap.
The study was able to indicate the condition of environmental sanitation in Gondar town mainly in relation to water supply, housing, sanitation and hygienic practices. The situation in most cases was very poor. This may be due to social, economic, cultural and relevant knowledge barriers in the study area.
The average consumption of water in the study area was low (12 litres per household) compared to other urban areas of Ethiopia. Inability to pay for water, poor health awareness, and the poor level of personal hygiene might explain the below-average amount of water consumption. Diarrhoea, poor personal hygiene and eye problems were found to be common health problems in the study area. The standards of personal and environmental hygiene were very low where water was not adequately used.
(Adapted from Admassu, M., Wubshet, M. and Tilaye, T. (2004) Sanitary Survey in Gondar Town, Ethiopian Journal of Health Development, vol. 18, no. 1, pp. 39–42.)
SAQ 11.1 (tests Learning Outcomes 11.1 and 11.3)
- a.From your reading of Case Study 11.1, what demographic and epidemiological data were collected in the study?
- b.What conclusions were drawn from these data about demographic factors affecting the hygiene and sanitation practices of households in the study area?
Answer
- a.The demographic data collected in the study were: gender, number of households, population density, literacy rates and income levels.
- b.The researchers concluded that the factors affecting the hygiene and sanitation practices of households in the study area were:
- Population density: high risk of exposure to poor environmental conditions among households in high-density areas.
- Income and educational status: more latrine availability was found among the better off households in terms of income and educational status, whereas those with low income and educational status had worse access to safe water and sanitary facilities.
SAQ 11.2 (tests Learning Outcomes 11.3)
What factors, other than economic or demographic, contributed to poor environmental sanitation in Gondar town?
Answer
The factors that contributed to poor environmental sanitation in Gondar town, other than economic or demographic, were:
- Behavioural factors, e.g. poor awareness in the community of how diarrhoeal diseases are transmitted.
- Physical factors, e.g. the low average consumption of water.
SAQ 11.3 (tests Learning Outcomes 11.3)
What were the common illnesses (morbidity) identified by the researchers that were associated with a low average amount of water usage?
Answer
Diarrhoea and eye problems were the common illnesses (morbidity) identified by the researchers that were associated with low average amount of water usage.
SAQ 11.4 (tests Learning Outcomes 11.2 and 11.3)
Can this research study described in Case Study 11.1 be used as part of the community profile for the sanitary situation in the study area? Explain why or why not.
Answer
Yes, this research study can be used as part of the community profile for the sanitary situation in the study area because information on demographic factors, latrine availability, solid waste management and drinking water supply at community (household) level was collected and analysed by the researchers.