Use 'Print preview' to check the number of pages and printer settings.
Print functionality varies between browsers.
Printable page generated Tuesday, 21 July 2026, 9:15 PM
Communicable Diseases Module: 12. Monitoring and Control of Malaria Epidemics
Study Session 12 Monitoring and Control of Malaria Epidemics
Introduction
Disease surveillance and epidemic monitoring and control are discussed in detail in Study Sessions 40‒42 of Communicable Diseases, Part 4.
Early detection and a prompt response to malaria epidemics is essential to minimise the impact of the illness (including deaths) and the socio-economic burden following malaria epidemics. In this study session you will learn how a malaria epidemic is defined in general and how it can be recognised in your village. You will also learn about factors that can trigger epidemics, about the supplies and drugs you need to be prepared for epidemics, and the different ways to contain epidemics. All this information will enable you to detect malaria epidemics early and to implement interventions to contain them fast.
Learning Outcomes for Study Session 12
When you have studied this session, you should be able to:
12.1 Define and use correctly all of the key words printed in bold. (SAQs 12.1, 12.5, 12.6 and 12.7)
12.2 Define a malaria epidemic in general and in your village. (SAQs 12.1, 12.2 and 12.5)
12.3 List and explain how you would monitor the factors that trigger malaria epidemics. (SAQs 12.1 and 12.2)
12.4 Explain why you have to prepare for malaria epidemics, and list the supplies and drugs you need in reserve in case an epidemic occurs. (SAQs 12.1 and 12.3)
12.5 Explain the measures that can be taken to prevent malaria epidemics. (SAQ 12.4)
12.6 Describe how to use early warning and detection tools for malaria epidemics. (SAQs 12.1 and 12.5)
12.7 Describe the measures used to control malaria epidemics. (SAQ 12.6)
12.8 Describe the importance of post-epidemic evaluation. (SAQ 12.7)
12.1 What is a malaria epidemic?
An epidemic, in general, is defined as the occurrence of cases in excess of the number expected in a given place and time period. Malaria epidemics are defined in this way.
In some places, malaria transmission increases after the rainy season and then decreases during the dry season every year. If this is what normally occurs in your village, then an abnormal increase above this normally expected seasonal variation is considered an epidemic.
Imagine that your village is in an area where there is no malaria. How many malaria cases would be expected? Giving reasons, say how many malaria cases would have to occur in your village for an epidemic to be recognised?
Zero malaria cases would be expected. If even one case of malaria occurs in the village, then this would be recognised as a malaria epidemic, because it is more than the number that would be expected in this village.
In order to know whether there is malaria in the village you are working in, look at the patient register in your Health Post and see if there are malaria cases for the past three to five years. If there are malaria cases, and the patients had no travel history to a malarious area prior to their infection, then your village is in a malarious area. If there are no malaria cases for these years, then your village is malaria-free.
12.2 Factors that trigger epidemics
In Study Session 7 you learned about factors that affect the transmission of malaria. In this section you will learn how some of those factors are also associated with the occurrence of malaria epidemics.
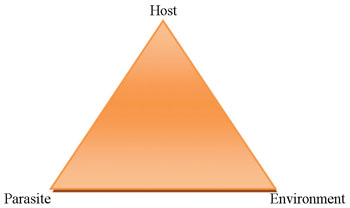
The ‘host’ is the infected organism — in malaria, the host is always a human.
Malaria epidemics are triggered by factors linked to the human host, the mosquito vector (the environment) and malaria parasites, as you can see in Figure 12.1. The change or disruption of the ‘balance’, between these three factors at any one time may increase the likelihood of an epidemic. That is, there is an increased risk of a malaria epidemic, if there is an increase in:
- the susceptible human population
- the number of mosquito vectors
- an increase in the number of people who have the malaria parasite in their blood.
You need to carefully and closely monitor changes in these factors in order to predict the risk of an epidemic. How some of these factors can be monitored is described next.
12.2.1 Environmental factors
Temperature, humidity and rainfall are major environmental factors affecting the development of both mosquitoes and parasites, as you learned in Study Session 6.
Higher environmental temperatures, between 22°C and 30°C, increase the potential lifespan of mosquitoes, and also increase the frequency of blood meals taken by female mosquitoes. Higher temperatures also speed up development of the mosquito larvae, shortening the amount of time it takes the mosquito to develop from egg to adult. All these increase the risk of malaria transmission.
Can you mention the stages of the lifecycle of the Anopheles mosquito?
Egg → larva → pupa → adult.
Increased rainfall generally leads to the creation of new water pools, allowing mosquitoes to breed in larger numbers. Increased rainfall also leads to increased humidity. On the other hand, sometimes during the dry season, rivers and streams can shrink to create water pools, making them ideal for mosquito breeding.
So observing significant changes in rainfall, temperature and humidity in your village can help you assess the risk of malaria epidemics.
12.2.2 Human factors
Immunity
Lack of immunity or low immunity to malaria in the human population makes epidemics more likely. In areas of unstable transmission, such as Ethiopia, population immunity is generally low, so epidemics are more likely. Indeed, malaria is a risk in 75% of the villages in Ethiopia and epidemics can occur in those villages.
Migration
Movements of people can contribute to malaria epidemics in two ways. First, people with malaria moving into an area where malaria has been controlled or eliminated can be sources of Plasmodium parasites for local mosquitoes, precipitating an epidemic. Second, non-immune people moving to areas where malaria is highly endemic can cause an apparent epidemic, as they are more susceptible than the local population to malaria.
Interruption of vector control efforts
In Study Sessions 9, 10 and 11 you learned that larval control, indoor residual spraying (IRS) of households with insecticides, and use of insecticide treated nets (ITNs), are important malaria prevention tools. If the implementation of these measures is stopped, vector populations and thus malaria transmission may increase dramatically. Similarly, epidemics can occur if vectors become resistant to insecticides and are no longer killed by spraying.
12.2.3 Parasite factors
Drug resistance
Use of non-effective drugs may cause a malaria epidemic since Plasmodium infections will not be properly cleared, allowing parasites to stay longer in the blood of an infected person. This increases the number of people who carry the parasite in their blood, which in turn increases the opportunities for the mosquito vector to take an infected blood meal and then transmit parasites to new susceptible hosts.
12.3 Preparedness for malaria epidemics
As you have learned above, malaria epidemics can be triggered by a variety of factors, making it difficult to predict an occurrence. As malaria epidemics could occur in all malaria prone areas at any time, you need to be prepared for them at all times.
At Health Post level, preparedness includes having a stock of anti-malarial drugs, RDTs, insecticides and other supplies that are important to prevent or contain a malaria epidemic, in addition to the amount that is required for normal situations. This added amount (25% of the annual need) is called a contingency stock. You must keep the contingency stock in your store for use during epidemics. Following an epidemic, the contingency stock should be replenished.
If the usual annual requirement of the anti-malarial drug Coartem for your village is 800 doses, calculate the contingency requirement for the year. What is the total requirement of Coartem for your Health Post?
The contingency requirement is 200 doses. (To calculate the contingency multiply 800 by 25% or by 0.25. This gives 200 doses.) The total doses of Coartem required for the year for your Health Post is therefore 800+200 which is equal to 1,000 doses.
In this way, you should calculate the contingency stock for all the drugs and supplies listed in Box 12.1 below, and keep them in your store. If an epidemic does not occur, make sure you use the contingency stock before the expiry date.
Box 12.1 List of drugs and supplies needed in your contingency stock for a possible malaria epidemic
- Chloroquine tablets
- Chloroquine syrup
- Coartem tablets
- Quinine tablets
- Artemether injections
- Artesunate suppositories
- Multi-species Rapid Diagnostic Tests (RDTs)
- Insecticides for indoor residual spraying (IRS)
- Temephos for larval control.
12.4 Prevention of epidemics
Epidemic prevention depends on close monitoring of the epidemic-triggering factors described in Section 12.2. If you suspect that there is a favourable condition for malaria epidemics to occur, you must implement the following prevention activities immediately.
Indoor residual insecticide spraying (IRS)
In some villages IRS is undertaken every year in anticipation of epidemics following the rainy season. In other areas IRS is done when there is a change in one or more epidemic-triggering factors and the risk of an epidemic seems high. It is essential to apply IRS before the malaria transmission season or the anticipated epidemic. In this way it can have a significant effect on the incidence of transmission and reduce the likelihood of an epidemic.
Larval control
This is another important measure to prevent epidemics. As you learned in Study Session 9, anti-larval measures can easily be organised by mobilising the community. They are also cheap to implement. Larval control measures can only be implemented very close to or during the transmission season.
Insecticide treated nets (ITNs)
Providing ITNs to 100% of households in malaria-risk villages aims to reduce the risk of malaria epidemics.
12.5 Detection of malaria epidemics
In this section you will learn about methods for the early detection of malaria epidemics. Early detection means recognising potential epidemics as early as possible, so action can be taken to contain them before they get out of control and affect a large number of people. As a Health Extension Practitioner, you are the first to take action against any malaria epidemic that is detected.
Two major early detection methods for malaria are used in Ethiopia:
- Constructing an epidemic monitoring chart, using the ‘second largest number’ method;
- Doubling of weekly malaria cases compared to last year’s data.
These methods are described below.
12.5.1 Epidemic monitoring charts using ‘second largest number’ method
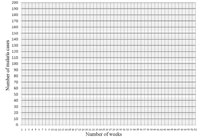
An epidemic monitoring chart is a chart drawn on a large sheet of paper. The x-axis (bottom or horizontal axis) of the chart shows the number of weeks, and the y-axis (the left-side, or vertical axis) shows the number of malaria cases (see Figure 12.2).
The epidemic monitoring chart is a tool that you can use only if you have data on malaria cases for the past five years.
You construct the epidemic monitoring chart using the second largest number seen on a weekly basis, in order to determine the expected number of malaria cases in your village.
Weeks are labelled as 1, 2, 3, 4 up to 52, which sometimes becomes 53. They are World Health Organization (WHO)’s epidemiological weeks. Week 1 always starts around the end of Tahsas. Note that every week starts on Monday and ends on Sunday. Table 12.1 shows the exact dates of the start of the weeks for the Ethiopian calendar (EC) for 2003, 2004, 2005 and part of 2006. Following the same pattern, you can calculate the week number for any year in the future.
| Week No | 2003/2004 EC | 2004/2005EC | 2005/2006 EC |
|---|---|---|---|
| Week 1 | Tahsas 25–Tir 1/2003 | Tahsas 23–29/2004 | Tahsas 22–28/2005 |
| Week 2 | Tir 2–8/2003 | Tahsas 30–Tir 6/2004 | Tahsas 29–Tir 5/2005 |
| Week 3 | Tir 9–15/2003 | Tir 7–13/2004 | Tir 6–12/2005 |
| Week 4 | Tir 16–22/2003 | Tir 14–20/2004 | Tir 13–19/2005 |
| Week 5 | Tir 23–29/2003 | Tir 21–27/2004 | Tir 20–26/2005 |
| Week 6 | Tir 30–Yekatit 6/2003 | Tir 28–Yekatit 4/2004 | Tir 27–Yekatit 3/2005 |
| Week 7 | Yekatit 7–13/2003 | Yekatit 5–11/2004 | Yekatit 4–10/2005 |
| Week 8 | Yekatit 14–20/2003 | Yekatit 12–18/2004 | Yekatit 11–17/2005 |
| Week 9 | Yekatit 21–27/2003 | Yekatit 19–25/2004 | Yekatit 18–24/2005 |
| Week 10 | Yekatit 28–Megabit 4/2003 | Yekatit 26–Megabit 2/2004 | Yekatit 25–Megabit 1/2005 |
| Week 11 | Megabit 5–11/2003 | Megabit 3–9/2004 | Megabit 2–8/2005 |
| etc. | etc. | etc. | etc. |
| Week 35 | Nehase 23–29/2003 | Nehase 21–27/2004 | Nehase 20–26/2005 |
| Week 36 | Nehase 30–Pagume 6/2003 | Nehase 28–Pagume 4/2004 | Nehase 27–Pagume 3/2005 |
| Week 37 | Meskerem 1–7/2004 | Pagume 5–Meskerem 6/2005 | Pagume 4–Meskerem 5/2006 |
| Week 38 | Meskerem 8–14/2004 | Meskerem 7–13/2005 | Meskerem 6–12/2006 |
| etc. | etc. | etc. | etc. |
| Week 51 | Tahsas 9–15/2004 | Tahsas 8–14/2005 | Tahsas 7–13/2006 |
| Week 52 | Tahsas 16–22/2004 | Tahsas 15–21/2005 | Tahsas 14–20/2006 |
Steps for plotting an epidemic monitoring chart
To establish a threshold or reference line for the expected number of malaria cases, you need to have data for malaria cases over the past five years, week by week (as shown in Table 12.2). Using the data you need to follow the steps below to graphically plot the relevant information on the epidemic monitoring chart. This will help you to detect a possible malaria epidemic as early as possible.
| Week No. | 1998 | 1999 | 2000 | 2001 | 2002 | Second largest number (1998–2002) | Current year (2003) |
|---|---|---|---|---|---|---|---|
| 1 | 8 | 42 | 6 | 36 | 14 | 36 | 20 |
| 2 | 12 | 42 | 27 | 38 | 17 | 38 | 22 |
| 3 | 10 | 42 | 43 | 49 | 21 | 43 | 35 |
| 4 | 20 | 17 | 34 | 59 | 32 | 34 | 37 |
| 5 | 34 | 17 | 46 | 20 | 30 | 34 | 36 |
| 6 | 18 | 10 | 34 | 22 | 23 | 23 | 30 |
| 7 | 12 | 19 | 33 | 24 | 25 | 25 | 29 |
| 8 | 37 | 10 | 27 | 41 | 23 | 37 | 32 |
| 9 | 32 | 18 | 37 | 29 | 26 | 32 | 30 |
| 10 | 31 | 24 | 28 | 17 | 13 | 28 | 25 |
| 11 | 22 | 19 | 22 | 12 | 23 | 22 | |
| . | . | . | . | . | . | . | . |
| 51 | 26 | 40 | 34 | 32 | 39 | 39 | |
| 52 | 23 | 35 | 10 | 27 | 25 | 27 |
Step 1 The villages that your Health Post serves is your catchment area. Therefore the data you use to determine the upper limit of the expected number of malaria cases are the cases from your catchment area.
Step 2 Check whether your data are arranged in weeks, as indicated in Table 12.2. One of the sources of the weekly data is the weekly surveillance report that you send to the higher level health facility. The weeks you use are the same as those used in your weekly surveillance report.
Step 3 Tabulate your malaria case data for the previous five to six years (as in Table 12.2). Look at the data: if there was a major epidemic with a large number of malaria cases in the previous five years ignore that year and consider data from the year before.
Step 4 If you have weekly data on malaria cases for five years, note the second largest number of cases from the previous 5 years’ data for a particular week. For example in the five years from 1998 to 2002 (EC), the second largest number of cases during week one is 36, and in week two it is 38 (see Table 12.2). Identify the second largest number of cases for each of the 52 weeks.
Step 5 Plot the second largest number for each week on the epidemic monitoring chart. The line in blue ink in Figure 12.3 is a plot of the upper limit or second largest number, based on the data in Table 12.2. (Note that not all the data plotted in Figure 12.3 are shown in Table 12.2, for reasons of space). This line represents the normal upper limit for the number of cases, or the expected cases of malaria, in the catchment area. It is called the reference line, because it serves as a reference point with which to compare weekly data on malaria cases for the following year.
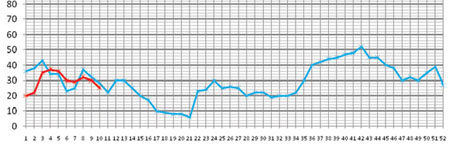
Step 6 During the following year (in the case of Table 12.2 this is 2003, EC), using a different colour of ink, plot the number of malaria cases seen each week on the epidemic monitoring chart (on which you already have the reference line). Plot the previous week’s data on Monday morning.
Step 7 If the number of cases for a particular week in 2003 exceeds the number on the reference line, it indicates the beginning of an epidemic. For example in Table 12.2, in weeks 4, 5 and 6, the number of malaria cases seen are above the reference line. Therefore, by definition, there is an epidemic in these weeks. We say an epidemic has stopped when the weekly number of cases drops below the reference line.
Step 8 After data from all 52 weeks have been plotted for comparison with the reference line, you should draw a new reference line, using the most recent five-year data, to use for the following year. For example in Table 12.2 you would drop the 1998 data, and using the 1999–2003 data, identify a new second largest number for each week. Then using the new second largest number, you would plot the new reference line, against which you would plot data from 2004.
12.5.2 ‘Doubling of cases in a week method’
Doubling of the number of malaria cases in a given week compared to the same week in the previous year is another method used to detect epidemics early. You can use this method when you have less than five years of previous data (see Table 12.3). For example, if you only have data from 2003 that is broken down into weeks, you can compare data from the current year (2004, in this example) with the number of cases in the same week from the previous year, 2003. That is, you should compare Week 1 of 2003 with Week 1 of 2004, and so on.
You declare an epidemic if the number of cases in a particular week is double, or more than double, the number of cases in the same week of the previous year. For example in the data shown in Table 12.3, the data cases are doubled, or more than that, in Weeks 4 and 5.
| Week No. | 2003 | This year (2004) |
|---|---|---|
| Week 1 | 20 | 19 |
| Week 2 | 22 | 20 |
| Week 3 | 35 | 35 |
| Week 4 | 37 | 74 |
| Week 5 | 36 | 75 |
| Week 6 | 30 | 38 |
| Week 7 | 29 | 29 |
| Week 8 | 32 | 29 |
| . | . | . |
| Week 51 | 20 | 33 |
| Week 52 | 25 | 31 |
If you do not have last year’s data, then you can compare last week’s data with this week. If cases become doubled, or more than double, in this week, then you can consider it as an epidemic.
12.6 Epidemic control
If, using the methods described above, you detect a malaria epidemic, you must implement epidemic control measures immediately. You should also start searching for cases actively (active surveillance is described below) until the number of cases falls below the reference line. The epidemic control measures and actions you should take are summarised in the flow chart in Figure 12.4.
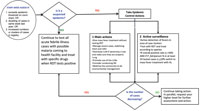
12.6.1 Epidemic control measures
Mass fever treatment
Once a malaria epidemic is detected and confirmed, treat all those people with fever without testing with RDTs. This is called mass fever treatment. Give Coartem to treat cases during mass fever treatment, unless the epidemic is definitely confirmed to be caused by P. vivax only, in which case you can use Chloroquine. Oral quinine is recommended for the treatment of infants of less than 5 kg body weight or less than four months old, and pregnant women with uncomplicated malaria (for dosage see Study Session 8). Severe cases should be treated as indicated in Study Session 8.
Vector control
Implement the following vector control measures immediately:
ITNs: If ITN coverage is low or if existing ITNs are worn out, distribute ITNs and make sure that they are hung properly and used by all family members.
Indoor residual spraying of all houses (IRS): This has a quick impact on transmission. In an epidemic this technique is highly reliable and recommended since its efficacy has little or no dependency on human behaviour.
Larval control: This should be undertaken by mobilising and organising the community to take action.
12.6.2 Active surveillance
After mass fever treatment, actively search for fever cases, test with RDTs and treat them according to the species of Plasmodium detected. Continue active surveillance until the number of cases has decreased to normal levels or to zero.
12.7 Post-epidemic assessment
So far in this study session you have learned how to prepare for, detect and control malaria epidemics. However, sometimes malaria epidemics occur in spite of your best efforts. In such cases you need to assess various aspects of the epidemic after it is over. The aim of post-epidemic assessment is to learn lessons that may strengthen your preparedness, detection, prevention and control methods in case of future epidemics.
12.7.1 Assess adequacy of epidemic detection and response
Some of the questions you should ask during post-epidemic assessment are:
- Did you use an epidemic monitoring chart?
If yes,
- How effective was it in detecting the epidemic early?
- How adequate were your contingency stocks?
- How speedy were your actions for vector control?
- How successful were your case management activities?
Careful post-epidemic assessment will show the strengths and weaknesses of the system in place at your Health Post level and of your actions in tackling the epidemic. The investigation should focus on how efficient the system was in confirming the epidemic, the status of preparedness (drugs, insecticides, logistics, etc), the timing and impact of intervention measures, and the participation of the community and other partners. Identify both the strengths and weaknesses of the response to the malaria epidemic so you can build on the strengths and take appropriate actions to correct weaknesses. Your report or assessment will help you and your supervisors to improve the epidemic response system.
The following indicators will help you to monitor the success of your interventions.
Input indicators
- Availability and quality of active epidemic monitoring
- Stockpile of anti-malaria commodities, mainly RDTs, Coartem and other anti-malarial drugs and insecticides
- Community participation.
Process indicators
- Number of houses sprayed
- Number of larval control measures
- Number of trained village volunteers for emergency interventions such as spraying.
Output indicators
- Volunteers trained and people educated
- High coverage of vector control measures (LLINs and IRS).
Outcome indicators
- Time taken by cases to seek treatment
- Adherence to treatment
- Percentage of patients developing severe disease who were referred
- Flattening or sharp falling of the epidemic curve.
Summary of Study Session 12
In Study Session 12, you have learned that:
- A malaria epidemic is defined as the occurrence of cases in excess of the number expected in a given place and time period.
- The factors that trigger the occurrence of malaria epidemics are linked to environmental factors, human factors and parasite-related factors; the change in the balance between these factors leads to malaria epidemics.
- It is important to get prepared by having 25% contingency stock of anti-malaria drugs and other supplies to control unexpected malaria epidemics that might happen at any time.
- The three major interventions that you have to implement to prevent the occurrence of predicted malaria epidemics are indoor residual insecticide spraying, larval control, and distribution and correct use of ITNs.
- The two main methods you use to detect malaria epidemics as early as possible are construction of an epidemic monitoring chart using the second largest number method, and the use of doubling of weekly malaria cases compared to last year’s data.
- To contain a malaria epidemic, you implement mass fever treatment and vector control measures.
- Post-epidemic assessment of the response to malaria epidemics helps to evaluate the weaknesses and strengths of the response activities for better preparation for future epidemics.
Self-Assessment Questions (SAQs) for Study Session 12
Now that you have completed this study session, you can assess how well you have achieved its Learning Outcomes by answering the questions below. Write your answers in your Study Diary and discuss them with your Tutor at the next Study Support Meeting. You can check your answers with the Notes on the Self-Assessment Questions at the end of this Module.
SAQ 12.1 (tests Learning Outcomes 12.1, 12.2, 12.3, 12.4 and 12.6)
Which of the following statements is false? In each case, state why it is incorrect.
A Malaria epidemics are defined as the occurrence of cases in excess of the number expected in a given place and time period.
B Malaria epidemics can sometimes occur during the dry season.
C The contingency stock of Chloroquine tablets is 25% of the stock that is required to treat all P. vivax cases in a non-epidemic year.
D The reason why you use an epidemic monitoring chart or doubling of weekly cases at Health Post level is to detect epidemics early and report to district level without taking any control measures.
Answer
A is true. Like any other epidemics, a malaria epidemic is defined as the occurrence of cases in excess of the number expected in a given place and time period.
B is true. Malaria epidemics can occur during the dry season because the rivers that might get interrupted or shrink can create breeding sites for the Anopheles mosquitoes, and lead to epidemics.
C is true. As a rule 25% of contingency stock should be kept for the drugs and supplies that are required for the management of epidemics.
D is false. The purpose of early detection of malaria epidemics is so action can be taken to contain them before they get out of control and affect a large number of people. You are the first to take action against any malaria epidemics that are detected. Of course you also report to the district level.
SAQ 12.2 (tests Learning Outcome 12.3)
Assume your village is located in a malaria epidemic risk area. An unusually heavy rain in your area ended one week ago. Now the weather becomes full of sunshine. About 500 migrant workers come to your village from a non-malarious area one week after the rain ends to work on agriculture. From this story list the factors that might trigger a malaria epidemic.
Answer
The factors in the story that might trigger a malaria epidemic are:
- Heavy rainfall, followed by sunshine and warm temperatures, can lead to good breeding conditions for mosquitoes.
- High numbers of migrants who were not immune to malaria parasites because they came from a non-malarious area.
SAQ 12.3 (tests Learning Outcome 12.4)
List the drugs and supplies that you are required to keep in your contingency stock.
Answer
The following are the lists for your contingency stock:
Drugs
- Chloroquine tablets
- Chloroquine syrup
- Coartem tablets
- Quinine tablets
- Artemether injections
- Artesunate suppositories
Supplies
- Multispecies Rapid Diagnostic Tests (RDTs)
- Insecticide for indoor residual spraying
- Temephos for larval control.
SAQ 12.4 (tests Learning Outcome 12.5)
What are the main malaria epidemic prevention strategies?
Answer
IRS, larval control and distribution of ITNs are the main malaria epidemic prevention strategies
SAQ 12.5 (tests Learning Outcome 12.6)
Table 12.4 contains seven years of weekly data on malaria cases. Study the table and then answer the questions below it.
| Week No. | 1998 | 1999 | 2000 | 2001 | 2002 | 2003 | second largest number | This year (2004) |
|---|---|---|---|---|---|---|---|---|
| 1 | 16 | 42 | 105 | 36 | 14 | 42 | 33 | |
| 2 | 12 | 42 | 100 | 38 | 17 | 22 | 35 | |
| 3 | 16 | 42 | 103 | 49 | 21 | 34 | 40 | |
| 4 | 20 | 17 | 134 | 59 | 32 | 40 | 39 | |
| 5 | 34 | 17 | 146 | 20 | 30 | 39 | 33 | |
| 6 | 18 | 10 | 134 | 29 | 23 | 27 | 30 | |
| 7 | 30 | 19 | 133 | 24 | 25 | 25 | 29 | |
| 8 | 37 | 10 | 127 | 41 | 23 | 42 | 42 | |
| 9 | 32 | 18 | 137 | 29 | 26 | 29 | 35 | |
| 10 | 31 | 24 | 128 | 17 | 13 | 32 | 30 | |
| . | . | . | . | . | . | . | . | |
| 51 | 26 | 40 | 134 | 32 | 39 | 39 | . | |
| 52 | 23 | 35 | 110 | 27 | 25 | 33 | . |
- a.Which year do you think the data shows an abnormally high number of malaria cases? What do you do with this year before you start identifying the second largest number?
- b.Identify the second largest number for the six years of data (1998–2003) and fill in the column in the table.
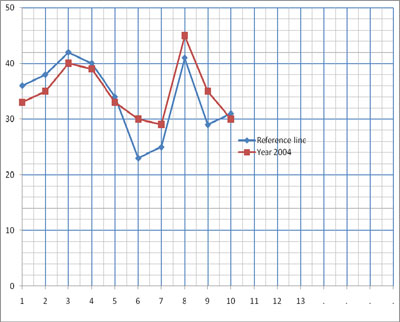
- c.Use the blank epidemic monitoring chart in Figure 12.2 to plot a reference line of the second largest numbers and the data for the year 2004 against it.
- d.Does the graph show weeks when an epidemic occurred? If yes, in which weeks?
Answer
| Week No | 1998 | 1999 | 2000 | 2001 | 2002 | 2003 | 2nd largest number | This year (2004) |
|---|---|---|---|---|---|---|---|---|
| 1 | 16 | 42 | 105 | 36 | 14 | 42 | 36 | 33 |
| 2 | 12 | 42 | 100 | 38 | 17 | 22 | 38 | 35 |
| 3 | 16 | 42 | 103 | 49 | 21 | 34 | 42 | 40 |
| 4 | 20 | 17 | 134 | 59 | 32 | 40 | 40 | 39 |
| 5 | 34 | 17 | 146 | 20 | 30 | 39 | 34 | 33 |
| 6 | 18 | 10 | 134 | 29 | 23 | 27 | 27 | 30 |
| 7 | 30 | 19 | 133 | 24 | 25 | 25 | 25 | 29 |
| 8 | 37 | 10 | 127 | 41 | 23 | 42 | 41 | 42 |
| 9 | 32 | 18 | 137 | 29 | 26 | 29 | 29 | 35 |
| 10 | 31 | 24 | 128 | 17 | 13 | 32 | 31 | 30 |
| . | . | . | . | . | . | . | . | |
| 51 | 26 | 40 | 134 | 32 | 39 | 39 | 39 | . |
| 52 | 23 | 35 | 110 | 27 | 25 | 33 | 33 | . |
- a.It is the year 2000. As you can see from Table 12.4 the weekly cases in 2000 are abnormally higher than the other five years of data. As a principle you do not use the 2000 data in constructing the normal chart. So before you identify the second largest number, remove the year 2000 from the data.
- b.See the table for the second largest number for the six years of data filled in the correct column.
- c.The reference line of the second largest numbers and the data for the year 2004 are shown in Figure 12.5.
- d.As you can see from Figure 12.5, epidemics occurred in weeks 7 to 10.
SAQ 12.6 (tests Learning Outcome 12.7)
What is mass fever treatment and which drug do you use for it?
Answer
Mass fever treatment means treating all the people who have fever without testing with RDTs, followed by malaria treatment to contain epidemics. The drug you give is Coartem, except for those contraindicated for whom you give quinine tablets.
SAQ 12.7 (tests Learning Outcome 12.8)
What do you think is the benefit of post-epidemic assessment?
Answer
Post-epidemic assessment benefits you in such a way that you learn your strengths and weakness. During the next epidemic you will correct your weaknesses and become more efficient in preparedness, detection, prevention and control of the epidemic.