2.1 What are the main uses of WGS data for surveillance?
The use of WGS for AMR surveillance has grown exponentially since it was introduced in the early 2000s. Public, veterinary and environmental health agencies around the world now use WGS as part of routine surveillance. In the US state of Washington, the Department of Health (DOH) integrated a genomics-first approach into its AMR surveillance system, with the result that it is now better able to identify additional outbreak cases, sensitively classify outbreak or non-outbreak cases, and confirm hypothesised linkages between cases (Torres, et al., 2025). In South Africa, the National Institute for Communicable Diseases conducts WGS-based AMR surveillance with support from the UK Aid Fleming Fund’s SeqAfrica project (DTU National Food Institute, n.d. 1).
Case Study 1 is an example of the use of WGS for AMR surveillance at the national level.
Case Study 1: DANMAP
The Danish Integrated Antimicrobial Resistance Monitoring and Research Programme (DANMAP) integrated WGS into its ongoing surveillance activities to monitor and control AMR starting in 2018. It now uses WGS to:
- improve the detection of resistance genes and mutations in bacterial pathogens
- monitor trends in AMR over time
- investigate and manage outbreaks of resistant infections.
DANMAP is a One Health system that can integrate data from various health registers, thereby connecting genomic data to patient-level metadata, such as hospital records, prescription data and regional food laboratory records and epidemiological information. DANMAP makes use of EPILINX, a visualisation tool that maps patient networks and tracks transmission events during healthcare-setting outbreaks. This tool supports molecular epidemiologists in linking patient movements, risk factors and infection sources through visualisations such as an
DANMAP’s website includes more information about the programme, including previous reports and recordings.
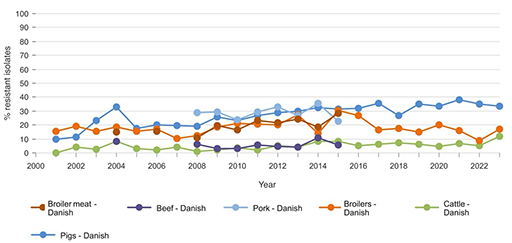
Figure 2 provides a demonstration of how this tool visualises AMR trends over time across different animal and food sources using DANMAP data (DANMAP, 2025).

Based on Figure 2, which source has the highest ampicillin-resistant E. coli levels from 2015 onward, and how does this compare to resistance in other livestock groups during that time? What might explain the difference?
Answer
From 2015 onwards, E. coli isolates from Danish pigs show the highest resistance to ampicillin, often exceeding 30%. In contrast, resistance in cattle remains consistently low, generally under 10%. This likely reflects differences in antimicrobial usage between pig and cattle production systems, as well as variation in infection pressure and treatment practices. For broilers, the level is intermediate between that observed in pigs and cattle.
In this section, you have seen examples that illustrate how WGS is transforming AMR surveillance by enabling more precise detection, tracking and response to resistance trends, while also allowing data to be integrated across sectors to follow outbreaks and monitor changes over time, ultimately supporting more effective, data-driven public health interventions.
2 How is WGS used in AMR-related surveillance?


