My OpenLearn Create Profile
- Personalise your OpenLearn profile
- Save Your favourite content
- Get recognition for your learning
Already Registered?

Whole genome sequencing in AMR surveillance (2025)
If you create an account, you can set up a personal learning profile on the site.
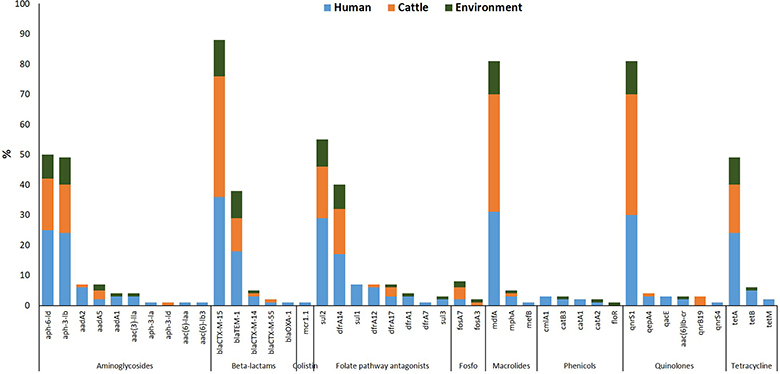
Figure 3 Percentage of different AMR genes detected in ESBL-producing Escherichia coli isolates from three sources: humans (blue), cattle (orange), and abattoir environments (dark green) in Nigeria (Aworh et al., 2022). Each bar represents the total number of isolates carrying a specific resistance gene (named under each bar), grouped by antimicrobial class. The data was generated using WGS, enabling detailed comparison of gene distribution across the human-animal-environment interface (Nilsson, 2025).
2.2 How can WGS surveillance supplement phenotypic surveillance?
For further information, take a look at our frequently asked questions which may give you the support you need.
If you have any concerns about anything on this site please get in contact with us here.