1.3.3 Bactericidal versus bacteriostatic antibiotics
While some antibiotic classes have consistent antibacterial effects, such as β-lactams which are nearly always bactericidal, the activity of other classes may depend on the dose of antibiotic prescribed or how long the treatment lasts. For example, fluoroquinolones and aminoglycosides, while usually bactericidal, may be bacteriostatic when used at low concentration.
You should by now have a good idea of how antibiotics interact with bacterial cells. You will now consider what happens to the bacterial population as a whole when antibiotics are administered.
In nature, bacterial growth follows a typical pattern shown in Figure 3. The growth curve comprises four phases:
- The lag phase: Bacteria are adapting to their environment; nutrients are plentiful and the cells grow in size. Cell number remains relatively constant, balanced by the deaths of some cells and division of others.
- The exponential/logarithmic (log) phase: This phase marks a big increase in cell numbers. Maximum growth rate is achieved, with a constant doubling of the bacterial population. Growth then slows as nutrients become depleted and bacterial waste products build up to toxic levels.
- The stationary phase: The bacteria enter this phase when the number of new cells equals the number of cells dying. The total number of cells in the population remains constant.
- The death/decline phase: Unless nutrients are replenished and waste products are removed, the bacteria progress to the death phase. More cells die than are produced and the number of cells in the population declines; however, some cells may remain viable (capable of surviving).
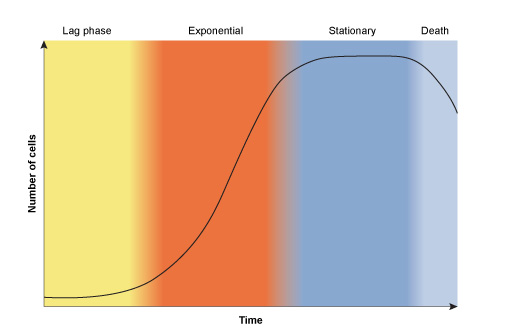
Figure 3 Graph of bacterial growth showing how the number of cells changes with time in a culture in which the bacteria are reproducing by binary fission.
Show description|Hide descriptionThis figure is a simple graph in which the horizontal axis is labelled time and the vertical axis is labelled number of cells. The four phases of the growth curve are distinguished using background shading of different colours. In the lag phase (yellow), cell number increases very slowly with time; cell number increases progressively rapidly during the exponential phase (red), levels off to a constant value in the stationary phase (blue), then falls during the death phase (grey).
Bacteria are at their most susceptible to antibiotic attack when they are actively growing. You will now consider what happens to a bacterial culture when antibiotics are introduced during this exponential phase of growth.
Activity 4: Effect of antibiotics on bacterial growth
Timing: Allow about 10 minutes
Bacteriostatic antibiotics
(a) A typical growth curve is shown in Figure 4a.
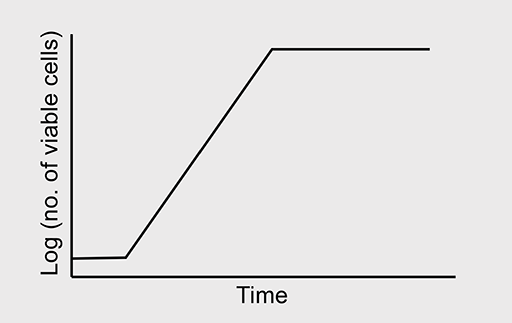
Figure 4a A typical growth curve.
Show description|Hide descriptionThis figure shows a representation of the growth of a bacterium in the presence of antibiotic A. The horizontal axis is labelled time and the vertical axis is labelled log (no. of viable cells). The line crosses the vertical axis near the bottom before sloping upwards. The first arrow indicates the timepoint at which antibiotic A was added. After the first arrow the line flattens out and remains constant.
Figure 4b shows the normal growth curve of a bacterium which is sensitive to the bacteriostatic antibiotic ‘A’. What will happen to the bacterial growth rate when ‘A’ is added to the culture in high concentration where all other growth conditions are optimal?
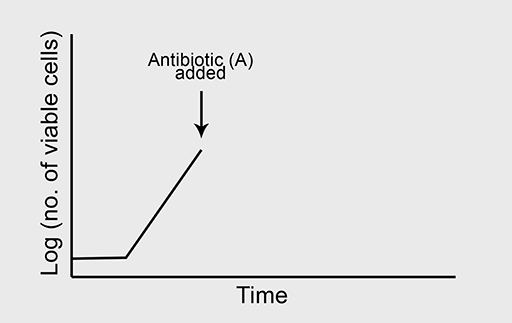
Figure 4b Normal growth curve of bacterium in the absence of antibiotic A.
Show description|Hide descriptionThis figure shows a representation of the growth of a bacterium in the absence of antibiotic A. The horizontal axis is labelled time and the vertical axis is labelled log (no. of viable cells). The line crosses the vertical axis near the bottom before sloping upwards up until a point at which antibiotic A was added, which is indicated by an arrow. At this point the graph stops.
Answer
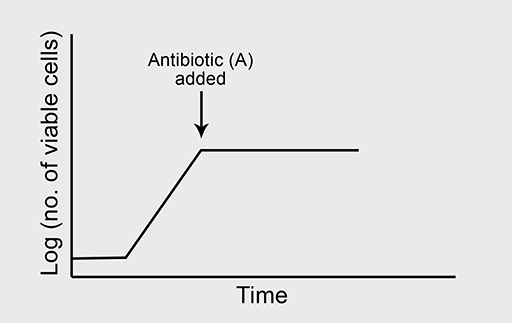
Figure 4c The bacterial population remains constant as the cells are prevented from growing and dividing.
Show description|Hide descriptionThis figure shows a representation of the growth of a bacterium in the presence of antibiotic A. The horizontal axis is labelled time and the vertical axis is labelled log (no. of viable cells). The line crosses the vertical axis near the bottom before sloping upwards. The first arrow indicates the timepoint at which antibiotic A was added. After the first arrow the line flattens out and remains constant.
(b) Now predict what will happen to bacterial growth if antibiotic A is removed from the culture at the point indicated on the graph in Figure 4d.
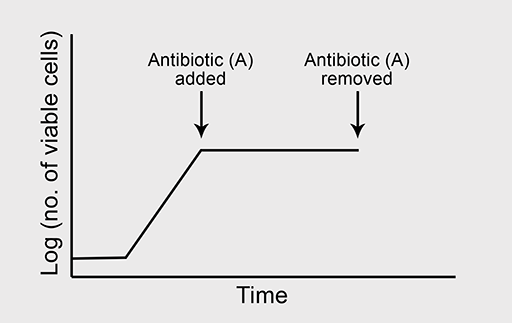
Figure 4d The bacterial population remains constant as the cells are prevented from growing and dividing.
Show description|Hide descriptionThis figure shows a representation of the growth of a bacterium in the presence of antibiotic A. The horizontal axis is labelled time and the vertical axis is labelled log (no. of viable cells). The line crosses the vertical axis near the bottom before sloping upwards. The first arrow indicates the timepoint at which antibiotic A was added. After the first arrow the line flattens out and remains constant. The second arrow indicates when antibiotic A was removed. At this point the graph stops.
Answer
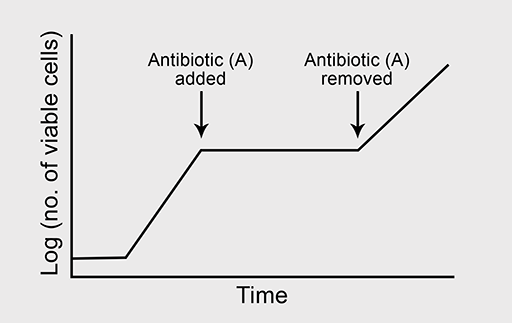
Figure 4e As the bacteria are still alive and nutrients are plentiful, the cells can now grow and divide, and the population starts to increase again.
Show description|Hide descriptionThis figure shows a representation of the growth of a bacterium in the presence of antibiotic A. The horizontal axis is labelled time and the vertical axis is labelled log (no. of viable cells). The line crosses the vertical axis near the bottom before sloping upwards. The first arrow indicates the timepoint at which antibiotic A was added. After the first arrow the line flattens out and remains constant. The second arrow indicates when antibiotic A was removed. After this point the line continues to slope upwards.
Bactericidal antibiotics
Figure 5a shows the normal growth curve of a bacterium that is sensitive to the bactericidal antibiotic ‘B’. What will happen to the rate of bacterial growth when B is added to the culture in high concentration? Again, you should assume that growth conditions are otherwise optimal.
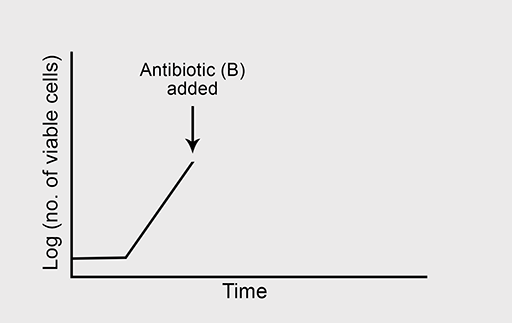
Figure 5a Normal growth curve of the bacterium in the absence of antibiotic B.
Show description|Hide descriptionThis figure shows a representation of the growth of a bacterium in the absence of antibiotic B. The horizontal axis is labelled time and the vertical axis is labelled log (no. of viable cells). The line crosses the vertical axis near the bottom before sloping upwards. The arrow indicates the timepoint at which antibiotic B was added. At this point the graph stops.
Answer
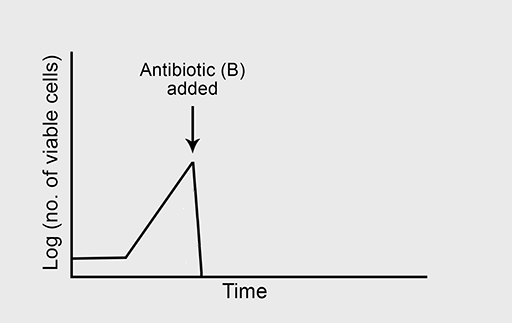
Figure 5b The number of bacterial cells falls rapidly as the cells are killed.
Show description|Hide descriptionThis figure shows a representation of the growth of a bacterium in the presence of antibiotic B. The horizontal axis is labelled time and the vertical axis is labelled log (no. of viable cells). The line crosses the vertical axis near the bottom before sloping upwards. The arrow indicates the timepoint at which antibiotic B was added. After the arrow the line slopes sharply towards the horizontal axis.
Bactericidal antibiotics kill susceptible bacteria during the exponential phase of growth and help to eliminate the infection.
Bacteriostatic antibiotics stop bacterial growth even though the cells remain viable. This allows time for the host’s immune system to be activated and target the bacterial pathogen – again effecting a cure.