

8.1 Data collected by surveillance networks
Data reported to surveillance systems should be based around:
- what the surveillance system is designed to do
- guidelines set out by the WHO, OIE, FAO, or global surveillance networks
- the types of infection that are present in the setting or country where the data is being collected
- which types of samples can be collected, for example, blood, faeces, or swabs from patients or equipment.
AMR surveillance is usually limited to a number of priority pathogen-antimicrobial (bug-drug) combinations. Section 5 gave details on the data required for some surveillance systems such as EARS-NET, ReLAVRA and GLASS. It is not possible to monitor all forms of resistance in all microbes continuously, so any surveillance system must make a pragmatic choice about the highest priority and the easiest organisms to collect AMR data on.
As discussed above, data collected by surveillance networks are not restricted to antimicrobial susceptibility and resistance data: data on antibiotic usage and consumption can also be collected in the same systems. The choice of what data to collect depends on the purpose of the system. Clinical, patient demographic and epidemiological information often accompany AMR/C/U data and provide crucial contextual information, which is vital to interventions or decisions made as a result of communicating these data.
In local surveillance networks, this contextual data might include:
- the patient’s date of birth and gender
- the type of specimen
- the patient’s diagnosis
- any antimicrobial therapy that has already been given
- whether the infection was hospital- or community- acquired.
Patient information is important because it helps to inform practical guidelines for antimicrobial use. For example, if a particular organism is most commonly found in samples taken from outpatient clinics to treat a human health condition, then the treatment guidelines for this type of infection in this setting could be revised in light of the AMR levels detected by the surveillance system.
Data must be collated and reported in a format that can be readily used, for example to determine antimicrobial susceptibility and resistance patterns across multiple bug-drug combinations, or to compare antibiotic use in animals between different countries or over time. You will now look at data submitted via the OIE tool and go through a specific example which highlights the need for complete, context-rich data.
An example: data reported via the OIE tool
As discussed in Section 2.3, the OIE has established a worldwide database that monitors quantities of antimicrobials intended for use in animals. In 2019, data to the OIE was submitted by 153 countries (OIE, 2020), as shown in Table 1.
| OIE region | Number of countries that submitted reports | Number of OIE members Footnotes 1 | Proportion of response (%) |
|---|---|---|---|
| Africa | 44 | 54 | 81 |
| Americas (OIE members) | 29 | 31 | 94 |
| Americas (non-contiguous territories) Footnotes 2 | 1 | n/a | n/a |
| Asia, Far East and Oceania | 25 | 32 | 78 |
| Europe | 48 | 53 | 91 |
| Middle East | 6 | 12 | 50 |
Footnotes
Footnotes 1 Distribution of countries by OIE region is done according to the OIE Note de Service 2010/22 – Annex 9 Back to main textFootnotes
Footnotes 2 Due to geographic distribution, non-contiguous territories were included in the Americas Back to main textCan you recall what variable AMU data is adjusted by to provide a rate, e.g. by country, allowing for comparisions between countries and regions?
AMU data are often adjusted for animal biomass.
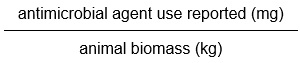
Meaningful comparisons need to be made between antimicrobial reports intended for use in animals and those which take into account total animal populations (which vary yearly and between countries and regions). A calclulation known as ‘animal biomass’ enables these comparisons to be made, and this is calculated as the total weight of live animals in a given population, country and year. Animal biomass is used as a proxy measure for animals likely to be exposed to antimicrobials. The approach to calculating animal biomass varies between species and is not covered in this module. Antimicrobial use is adjusted for animal biomass according to the following calculation:
AMU data that has been adjusted by animal biomass allows for patterns to be analysed (Figure 11).
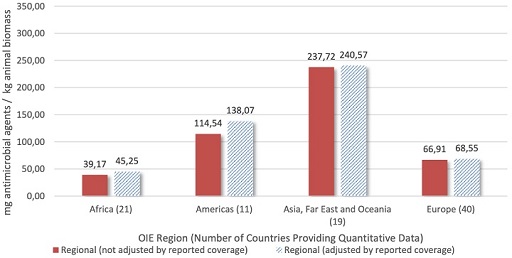
From Figure 11, how does the quantity of antimicrobial agents figure for ‘Asia, Far East and Oceania’ compare to that of Europe?
The quantity of antimicrobial agents figure for Asia, the Far East and Oceania is higher than that of Europe.
By what factor does the quantity of antimicrobial agents figure for Asia, the Far East and Oceania exceed that of Africa?
By approximately a factor of 5.
What factors might explain the differences in these figures for the quantity of antimicrobial agents, between regions?
Socio-economic, geographical, predominant method of animal husbandry are some of the factors that could explain the differences.
8 Surveillance methods and design
