

8.2 Surveillance system design
Finally for this module, you will learn about the design of surveillance systems using some examples.
In an
An example of an active surveillance methodology used in the animal sector to help monitor rates of resistance, is the work undertaken by the European Antimicrobial Susceptibility Surveillance in Animals (EASSA). The potential for transmission of antimicrobial resistant bacteria from food-producing animals to humans via contaminated food is a serious public health concern. The EASSA programme collects bacterial isolates using standard and uniform methods from healthy food-producing animals, focusing on bacterial species such as Salmonella and Campylobacter spp. as well as commensal Escherichia coli and Enterococcus spp. Slaughterhouses from countries which participate in the programme are purposefully chosen based on animal throughput, with samples sent to a central laboratory for antimicrobial susceptibility testing. The results derived help illustrate the scope of antimicrobial resistance in the food-producing animal sector (De Jong, 2013).
A
An example of passive surveillance systems in the animal sector is the work done by the Canadian Integrated Program for Antimicrobial Resistance Surveillance (CIPARS) in Canada. CIPARS relies partially on diagnostic samples submitted routinely by producers to local animal health laboratories, which are then submitted to a central laboratory for further analysis. A particular focus is Salmonella, with continual analysis through passive surveillance allowing for trends in resistance within this bacterial species to be observed over time.
Passive surveillance systems are often (though not always) less time-consuming and less expensive than active surveillance systems. However, active surveillance systems typically allow more comprehensive data gathering, i.e. data gathered against a larger number of variables, targeted to answer a specific question from a representative sample, than passive surveillance, but at a greater cost. Most national AMR surveillance systems in high-income countries are based around a passive surveillance system.
Lastly let us look at a
The WHO’s GLASS AMR programme supports a sentinel site approach, particularly for low and middle-income countries where it is neither feasible nor necessary, to collect data from every healthcare facility. Countries focus their efforts on collecting good quality data from a selection of sites chosen to represent different levels of healthcare and reasonable population coverage, making establishing a surveillance system more affordable and achievable. Further sites can be added to the system at any stage, providing they meet the data quality requirements.
A
Activity 6: The surveillance system in your country and context
Find out which types of surveillance systems you have in your country and sector. Are they active or passive, or part of a sentinel surveillance system or point prevalence survey? You may want to consider particular activities that you engage with at your workplace that fit with the descriptions in the section above. You may also want to discuss this with the lab manager or your supervisor.
Activity 7: Self-assessment
a.
Active surveillance system
b.
Sentinel surveillance system
c.
Passive surveillance system
d.
All of the above
e.
None of the above
The correct answer is d.
An
Note that if antibiograms are being used to summarise across a collection of bacteria then we ought to ensure:
- isolates belong to the same species
- the method by which the isolates are collected is similar or comparable
- that the analysis includes a minimum of ten isolates in order for the final analysis to be meaningful.
Antibiograms can be used to track resistance trends and compare susceptibility rates between different hospital departments, healthcare facilities, farms, regions or countries. Antibiograms can also be used by clinicians and veterinarians to guide treatment decisions.
Activity 8: Analysing AMR susceptibility data
Part 1
Figure 13 shows an example of an antibiogram. The first column lists the organisms that were included. The second column shows the number of isolates of that organism that were tested and included in the antibiogram. As a rule of thumb, to make general statements about patterns of antibiotic resistance you should have at least ten bacterial isolates of a particular species – but the more, the better. The remaining columns show the antimicrobials that were tested. The values show the percentage of organisms susceptible to each antibiotic.
Some antibiograms are colour-coded to reflect their general patterns of resistance. Bug-drug combinations that are mainly susceptible are coloured green, whereas combinations that are predominantly resistant are coloured red. Intermediate levels of resistance are coloured yellow. These results reflect many individual susceptibility tests, which are determined using standardised susceptibility testing methods as described in the Antimicrobial susceptibility testing module.
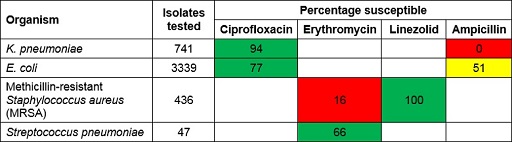
Study Figure 13 and use it to answer the following questions:
- Which Gram-negative organisms are included?
Answer
K. pneumoniae and E. coli.
- What percentage of E. coli isolates are susceptible to ampicillin?
Answer
51%.
- Which pathogen-antimicrobial combinations show high levels of resistance?
Answer
K. pneumoniae-ampicillin and MRSA-erythromycin. K. pneumonia is intrinsically resistant to ampicillin so this result is expected. However, the antibiogram also indicates that infections due to MRSA are highly likely to be resistant to erythromycin, and that nearly half of the infections due to E. coli are also likely to be resistant to ampicillin.
Part 2
Does your workplace use antibiograms to report cumulative antimicrobial susceptibility data?
If you have access to an antibiogram from your workplace, you should use it for the rest of this activity. If you do not have access to an antibiogram from your workplace, use the interactive antibiogram tool provided by Stanford University [Tip: hold Ctrl and click a link to open it in a new tab. (Hide tip)] to select three organisms and three antimicrobials, and generate your own antibiogram. Note that data are not available for all combinations of pathogens and antimicrobials.
Once you have your antibiogram, make a note of any bug-drug combinations where resistance is reported and consider the following points:
- Which levels of susceptibility/resistance would you colour code red, yellow, green?
- How would you explain to a clinician what a 25% susceptible rate means? Does it mean the antibiotic will work 25% as well as if there was no antibiotic resistance?
- What are the likely local effects on an antibiogram of different stewardship activities (eg increased/decreased local use of particular antibiotic)? What period of time might it take for changes to be seen?
Please add your thoughts and reflections to your reflective blog, and discuss them with your colleagues to see what they would say.
8.1 Data collected by surveillance networks
