

4.2.2 Descriptive statistics for a numeric variable
Descriptive statistics for numeric variables (continuous or discrete) include measures of
Measures of central tendency include:
- The
arithmetic mean : the sum of all values divided by the number of values, also known as the ‘average’. The arithmetic mean provides a valid measure of the central tendency only when the data is approximatelynormally distributed . This method is the most often used to estimate means, and therefore when someone reports a ‘mean’ or ‘average’ without specifying which type of mean, it is an arithmetic mean by convention. - The
geometric mean : the nth root of the product (multiplication) of the values, where n is the number of values. This measure is often used to summarise MIC values, which are generally not normally distributed. - The
median : the middle value in an ordered set of values. The median is the best measure of central tendency to use for non-normal data, for example,skewed orbimodal data. - The
mode : the most common value in a set of values. It can only be calculated when there are repeated values.
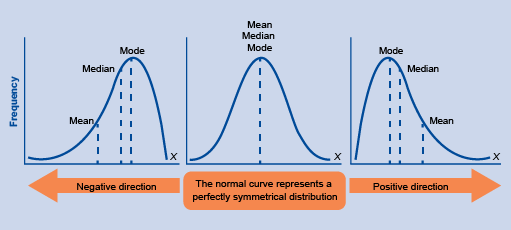
When data are normally distributed, the mean, median and mode are equal to each other. When the data are not normally distributed, each of these measures can take different values (Figure 2). Which measure is most useful therefore depends on the distribution of the data and the analysis objectives.
Activity 5: Calculating measures of central tendency
The ages of the first 12 patients diagnosed with MRSA during a hospital survey were 55, 98, 64, 81, 1, 70, 43, 29, 79, 84, 87 and 64. Calculate the (arithmetic) mean, median and mode of these ages.
Answer
The mean age is 63 (to the nearest integer) – the sum of the ages (755) divided by 12; the median is 67 – in the ordered set of ages the 6th and 7th ages are 64 and 67 and so, since there are an even number of ages, the median is the mean of these central ages (64 and 70); and the mode is 64, which occurs twice. As this distribution is skewed towards older ages, the median is higher than the mean.
Measures of dispersion include:
- The
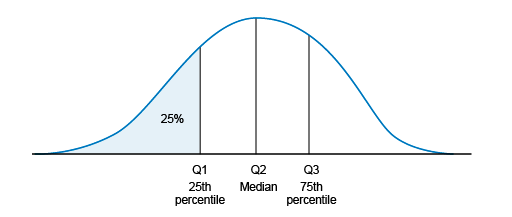
range : this is the difference between the minimum and maximum observed values. Percentiles : percentiles are calculated by ordering the set of values and dividing it in parts of equal sizes (with the same number of values inside). Commonly used percentiles are quartiles, as shown in Figure 3: the first quartile (Q1, also known as the 25th percentile) is the median of the lower half of the ordered dataset (25% of the values are below Q1). The second quartile (Q2) is the median. The third quartile (Q3) is the median of the upper half of the ordered dataset (75% of the values are below Q3).- The
interquartile range : this is the difference between the Q3 and Q1 values. - The
variance : this is a measure of how far on average each value in the set of values is from the mean. It is calculated as the average of the squared differences from each data point to the mean value. - The standard deviation: this is the square root of the variance, and therefore also measures how spread out the data is from the mean. Unlike the variance, the standard deviation is in the same unit of measurement as the data itself, which means it is easier to compare directly to the mean value.
These descriptive statistics may be reported in text, displayed in tables (see example in Table 4) or graphically (histograms and box-and-whisker plots, for example, which will be covered in the module Summarising and presenting AMR data).
| Minimum | 3 |
|---|---|
| Q1 | 12 |
| Median | 29 |
| Mean | 19 |
| Q3 | 75 |
| Max | 267 |
Feeling confused? It’s probably been a while since you learned about these concepts in high school. If you would like a refresher, you can watch the two videos below for worked examples of measures of central tendency (video 1), and for a refresher and worked examples on measures of dispersion (video 2).
Transcript: Video 1 8.5 minutes
Summary transcript of video 1: Video explaining the three common measures of central tendency and how they are determined: the mean (or arithmetic mean) as the sum of the values of the data points divided by their number; the median as the middle data point when the data points are arranged in numerical order; and the mode as the most common value. Each of these is valuable in different circumstances, although the mean is most frequently used.
Transcript: Video 2 12.5 minutes
Summary transcript of video 2: Video explaining measures of dispersion of a dataset, and how these can distinguish between very different datasets that nevertheless have the same mean. These include the range (the overall spread of the dataset); the variance (the average of the squares of the differences between each data point and the mean); and the standard deviation as the square root of the variance.
4.2.1 Descriptive statistics for categorical variables
