
1.3.2 Metrics of AMU
To compare quantitative data reported on antimicrobial agents intended for use in animals between regions and over time, a standardised measurement is needed that accounts for the fact that animal populations vary in size and composition. There is a consensus in the scientific community that a relative measure is needed, where the amount of antimicrobial (the numerator) is divided by a denominator that summarises the population at risk of being treated.
These can be weight-based metrics (e.g. mg or kg of active ingredient) or dose-based metrics (e.g. DDD). Data to estimate weight-based metrics are more often available, being a more accessible option for AMU monitoring at a worldwide level, whereas dose-based metrics provide a more accurate metric (Moreno et al., 2020).
Activity 4: Types of surveillance data and sources
Imagine a scenario where you would like to investigate the presence of resistant bacteria in a food production system and establish a baseline prevalence.
- Which type of surveillance systems would you choose?
Answer
- Active surveillance; specifically, sentinel surveillance if there are limited resources.
Look at the system in Figure 2. This is a general representation of a food production system illustrating the many different connections between drug providers (shown in red), farms (terrestrial livestock and aquaculture production systems) and following parts of the food chain (shown in yellow), the environment (shown in blue) and waste from food chain operations and human health (hospitals (shown in brown) This illustrates the central role of the environment in these types of systems.
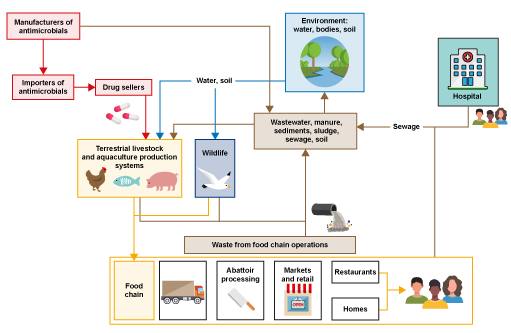
- Which type of data could be useful to investigate prevalence of resistant bacteria in animals and where it could be collected?
- Identify the points in the system to obtain other, different types of AMR surveillance data. Can you think how these data could be useful in combination?
Answer
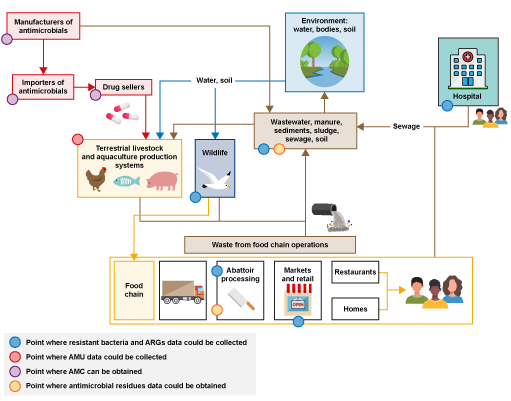
Figure 3 is an annotated version of Figure 2 that highlights points where different types of AMR surveillance data could be collected.
The first type of data you could collect is on the presence of resistant bacteria. Samples to detect resistant bacteria could be collected on farms, at abattoirs, at markets, from wildlife, in hospitals and primary care, and from the surrounding environment. These are illustrated by the blue dots in the amended figure.
Another type of data you could collect to complement the data on resistant bacteria is AMU data at farm level, as indicated by the red dot in Figure 3. AMU data would be useful to understand the potential role of AMU on resistance profiles collected from livestock present on the farms where samples were collected.
Data on AMC in animals could be collected from the pharmaceutical industry, such as drug sellers and pharmacies, as illustrated by the purple dots in Figure 3.
Data on antimicrobial residues could be obtained through sampling at abattoirs or in the environment, as illustrated by the yellow dots in the Figure 3, which could be compared to data on AMU in farms, to verify that the products reported match the substance identified.
1.3 AMR surveillance data
