
3.1 Data sources
The first point in a surveillance network is the data source. As explained in Section 1, there are several different types of data that can be collected for AMR surveillance, and these can be collected from a variety of sources. For example, local AMR surveillance data from animal systems can be obtained from biological samples and from records or surveys.
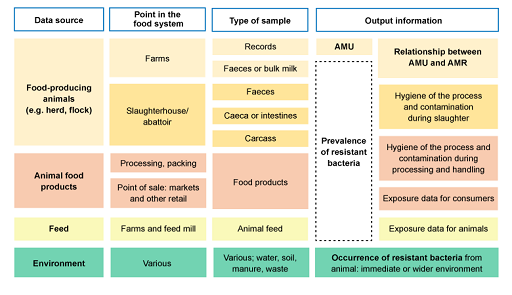
Figure 9 outlines information adapted from the active surveillance systems of AMR in food-producing animals (OIE, 2019). The figure shows the relationship between the sampling source, point in the food system where the sample can be obtained, which type of sample and what information is obtained.
For example, if the data source is food-producing animals, data can be collected at the farm, or post-harvest at the abattoir. Samples that could be collected on farms include AMU records or biological samples such as faeces or bulk milk. This can provide information on AMU, prevalence of resistant bacteria and the relationship between AMU and AMR.
Some considerations:
- Figure 9 only refers to the sources of data to investigate resistant bacteria and AMU in healthy food-producing animal populations. This would be relevant to investigate commensal and zoonotic foodborne bacteria that are a threat for public health.
- Clinical samples from animals could be a source of data for passive surveillance of animal pathogens. This would be of interest for the countries to address infectious diseases.
- The same sources of data outlined could be tested for the presence of antimicrobial residues. In the case of food-producing animals (such as testing the milk), this would provide an indication of recent treatment with antimicrobials or lack of compliance with the withdrawal period.
- What would be the value of interpreting this AMR information with information on AMU from the farm, and comparing results from residue testing from the food chain with AMU data?
- Comparing data on AMR and AMU can allow us to establish whether there is a relationship between the use of antimicrobials and occurrence and/or prevalence of resistance in bacteria, and measure the strength of this association.
- Comparing data on residues and AMU can provide more information on what is actually used on a farm. For example, if we detect residues in meat of an antimicrobial that is not found during an AMU survey, this tells us that there may be gaps in our AMU data, or that animals are being exposed to antimicrobials via alternative routes, such as the environment.
- What would be the value of interpreting data from different sources, such as other food-producing animal systems?
To understand interactions between different systems. For example, if data from an aquaculture system demonstrate high prevalence of resistance among bacteria, but we know that that antimicrobial is not used in fish, data on AMU and AMR in poultry farms nearby or from which faeces are used to fertilise the ponds may help us to identify, and control, the potential cause of occurrence of resistance in bacteria carried by fish.
3 Surveillance systems in the national context
