

2.2 Mapping AMR data
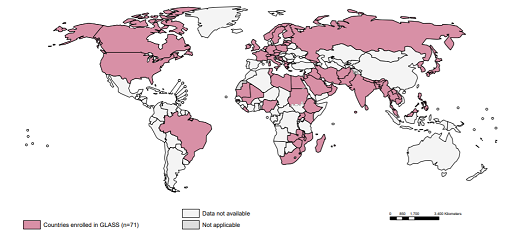
Maps are used extensively in disease surveillance because they can be used to display information on the spread of diseases across different geographic regions. For example, Figure 13 is a map where different colours are used to represent different categories of the indicator of interest (in this case, the number of countries enrolled in GLASS).
Because maps are so effective at telling a story, they are used by governments, NGOs, non-profits, public health departments, the media and at local levels to understand the situation in different areas.
Maps answer spatial questions about your data and can help you understand trends or patterns. It is a good idea to ask yourself whether a map is the best way to display data. If the answer is yes, then you need to ensure your map represents your data accurately, in sufficient detail and attractively.
The strengths and limitations of maps are listed below:
| Strengths | Limitations |
|---|---|
| Visually appealing and compelling | Can be hard to interpret if the geographic relationship to your variables of interest is unclear |
| Used to highlight important patterns if geography or location, and resource needs by location | Challenges ensuring privacy and availability of data for all regions being displayed |
| Effective for tracking the spread of diseases |
2.1.6 Line graphs
