
1.2.1 Basic descriptive statistics
Descriptive analysis is the process of summarising data and generally involves characterising and visualising your dataset. Depending on the nature of the data, you may only need to undertake a descriptive analysis before reporting your findings. The approach to descriptive analysis varies depending on whether the data is categorical or numerical.
1.2.1.1 Categorical variables
Descriptive statistics for categorical variables include counts (frequencies) and
AMR data is often presented as basic descriptive statistics in sentences in a report, in a frequency table, or in a visual format using a pie chart or a bar chart. An example of using text is in reporting the percentage of isolates that were resistant:
‘A large number of MRSA isolates showed resistance to levofloxacin (83.9%), ciprofloxacin (83%), erythromycin (77.7%), and clindamycin (72.3%).’
Activity 3: Approaches to presenting information
Figure 1 and Table 3 display data from the WHO GLASS dashboard showing AMC data for Daily Defined Dose (DDD) of antibiotics per 1000 inhabitants in African and Asian countries (WHO, n.d.). Table 3 is a
| Country | Defined daily dose |
|---|---|
| Benin | 21.0 |
| Cote d’Ivoire | 16.7 |
| Gabon | 19.9 |
| Kenya | 19.0 |
| Mali | 23.4 |
| Uganda | 25.3 |
| Brunei Darussalam | 4.1 |
| Lao People’s Democratic Republic | 20.6 |
| Bhutan | 9.6 |
| Maldives | 19.6 |
| Nepal | 78.9 |
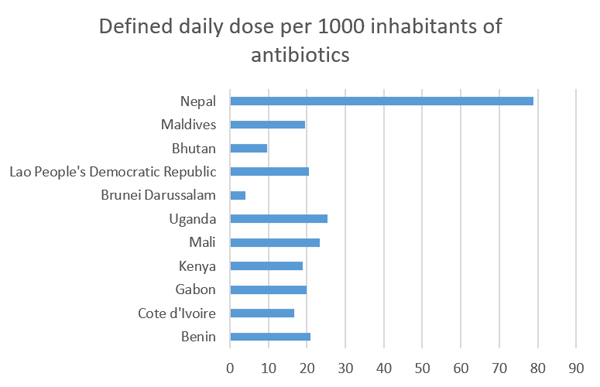
Which type of data display (Table 3 or Figure 1) do you think most effectively conveys information about the country with the highest and lowest DDD of antibiotics per 1000 inhabitants?
Answer
While tables can summarise and display data to great effect, in this example, the bar chart (Figure 1) demonstrates a superior approach to presenting the data. When looking at the bar chart, it can be rapidly determined that there is a pronounced difference between the highest DDD and lowest DDD by country.
Do you agree that your brain needs to work harder to get the same information from the table?
1.2.1.2 Quantitative variables
Descriptive statistics for quantitative (numerical) variables (continuous or discrete) include measures of
Descriptive statistics for quantitative variables can be reported as text, as a summary table, or using a
1.2 Review of different approaches to data analysis