Use 'Print preview' to check the number of pages and printer settings.
Print functionality varies between browsers.
Printable page generated Monday, 15 June 2026, 5:26 PM
AMR in the environment
Introduction
The environment plays a significant role in the development, transmission and spread of AMR (antimicrobial resistance), acting as a reservoir of AMR organisms and genes for human and animal pathogens.
This course will build on The problem of antimicrobial resistance, Introducing antimicrobial resistance and Introducing a One Health approach to AMR, exploring in depth the environmental dimensions of AMR and the role of environmental surveillance as part of a One Health multisectoral approach to addressing AMR.
After completing this course, you will be able to:
- explain how AMR emerges and is maintained in the environment, and how it is transmitted and spread within the environment and between the environment, humans and animals
- illustrate the main ways by which human activities, including animal husbandry, exacerbate AMR in the environment and how these could be managed
- explain the consequences of AMR organisms and mobile AMR genes in the environment
- demonstrate awareness of the links between AMR and pollution and waste
- explain the purpose(s) of environmental AMR-related surveillance and its importance as part of the One Health multisectoral approach to addressing AMR
- outline environmental surveillance methodologies
- explain what factors need to be considered when designing/implementing AMR-related surveillance in the environment
- describe an example of how environmental surveillance can be integrated with human and animal surveillance as part of a One Health approach.
In order to achieve your digital badge and Statement of Participation for this course, you must:
- click on every page of the course
- pass the end-of-course quiz
- complete the course satisfaction survey.
The quiz allows up to three attempts at each question. A passing grade is 50% or more.
When you have successfully achieved the completion criteria listed above you will receive an email notification that your badge and Statement of Participation have been awarded. (Please note that it can take up to 24 hours for these to be issued.)
Activity 1: Assessing your skills and knowledge
Before you begin this course, you should take a moment to think about the learning outcomes and how confident you feel about your knowledge and skills in these areas. Don’t worry if you do not feel very confident in some skills – they may be areas that you are hoping to develop by studying these courses.
Now use the interactive tool to rate your confidence in these areas using the following scale:
- 5 Very confident
- 4 Confident
- 3 Neither confident nor not confident
- 2 Not very confident
- 1 Not at all confident
This is for you to reflect on your own knowledge and skills you already have.
1 What is the environment and why is it important for AMR?
The environment is the space in which we live. It consists of different

Bacteria are found everywhere in the natural environment: for example, it is estimated that there are more than 10,000 different bacterial species in 1 gram of soil (Torsvik, Øvreås and Thingstad, 2002). Bacteria are critical for life on Earth and, fortunately, the great majority of them are not pathogenic and not resistant to clinically relevant antibiotics.
When considering ‘the environment’, you can also think of the built environment, including objects such as furniture, fabrics, books and so on. These objects can transmit disease by harbouring bacteria deposited by an infected person and subsequently touched by an uninfected person who thereby becomes contaminated. Such objects are called
1.1 The role of the environment in infectious disease transmission
In the field of infectious diseases the environment can be a reservoir and source of pathogens that can infect humans or animals. An example of this is Vibrio cholerae, a bacterium that has its primary reservoir in freshwater and seawater, and can cause the human infection cholera. Cholera causes profuse diarrhoea, and the spread of infection is aggravated if infected individuals discharge the infectious agent to water with their faeces, in turn leading to exposure of other humans.
The environment can also be a transmission route for pathogens that have animals as their primary host – so-called
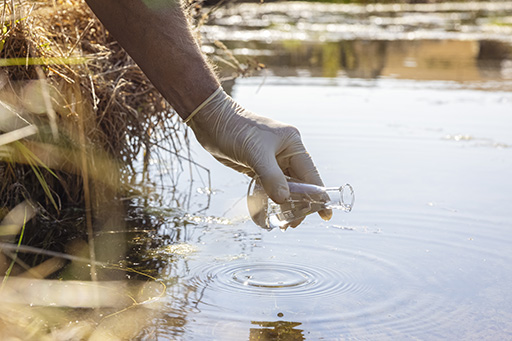
The same principles apply to AMR: the environment can act as a reservoir for resistant bacteria and the genes that confer AMR. In fact, antimicrobial-resistant genes (ARGs) have been found in samples that date back to before human times (D’Costa et al., 2011), indicating that such mechanisms are naturally present in the environment.
As well as being a source of AMR organisms or ARGs, the environment – water, air and soil – can also be a transmission route for bacteria, including antimicrobial-resistant bacteria. When bacteria are discharged from animals and humans, they can contaminate these environmental compartments (surface water, for example), potentially exposing other humans and animals to resistance.
2 One Health and the environment
In the field of AMR, the environmental sector has received less attention and has been studied for less time than the human and animal sectors.
One Health (Figure 3) is a central concept designed to place the environment on the same footing as the other domains with respect to the development and spread of AMR.
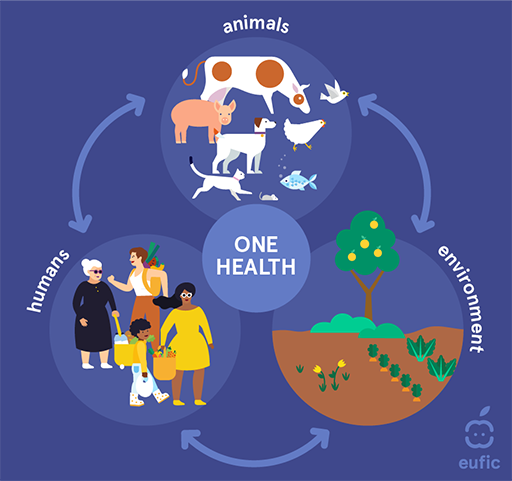
One Health has been introduced in more detail in the course Introducing a One Health approach to AMR. As a reminder, One Health means an integrated, unifying approach that aims to sustainably balance and optimise the health of people, animals and ecosystems (WHO, n.d. 1). As you can see from Figure 3, a One Health approach spans different sectors, including the human domain, terrestrial and aquatic animals (including animal production), plant production and the environment.
2.1 Processes involved in the development and transmission of AMR
Within and between the different One Health domains (humans, animals and the environment), a number of processes can occur that are involved in the development and transmission of AMR.
Emergence : AMR can emerge within any domain. This process can occur through evolution (that is, mutations in the DNA) or through transfer of ARGs on mobile genetic elements (plasmid s) that can spread to other bacterial species. These ARGs include ‘indigenous’ ARGs, which are already present in the environment without human influence.Introduction : AMR can be transferred from one domain to another, meaning that one domain can act as a ‘source’ of AMR being introduced to another domain.Transmission /exposure: Humans can be exposed to AMR through contact with any other domain.
If you are unsure about the concepts of ‘mutation’ and ‘gene transfer’, and how they relate to AMR development and transmission, you may like to study the course Introducing antimicrobial resistance before continuing.
Activity 2 gives you an opportunity to think about the processes involved in the development and transmission of AMR in your setting.
Activity 2: AMR processes in your setting
Before you touch upon these processes in more detail, think about your local setting. Can you think of one example of each of the following?
- How resistant bacteria or ARGs can be introduced into the environment from another domain.
- How humans can be exposed to resistant bacteria or ARGs through contact with the environmental domain.
Discussion
There are many possible answers to this activity. Here are a couple of examples:
- Resistant bacteria and ARGs can develop in the gut of farm animals and be excreted in manure. When this manure is used as fertiliser or when it runs off into nearby soil and water systems, it introduces resistant bacteria and ARGs into the environmental domain.
- Humans can be exposed to resistant bacteria or ARGs by swimming in or coming into contact with natural water bodies such as lakes or rivers.
The processes or pathways of introducing AMR into the environment and of exposure of humans to the environment that you identified in Activity 2 are examples of the many ways in which AMR in the environmental domain is linked with the other domains. In the following sections of this course you will explore this multitude of interactions between and within domains. You will use information from Introducing a One Health approach to AMR to identify more ways that AMR (resistant bacteria and ARGs) can be introduced from other domains into the environment. If you have not studied this course you should complete it first and then continue studying AMR in the environment (this course).
In Activity 3 you will start to study the emergence, introduction and transmission processes in more detail.
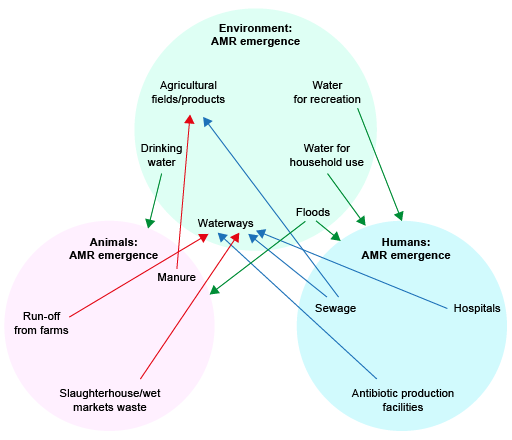
Activity 3: AMR transmission routes
Look at Figure 4, which shows the three One Health domains. One possible transmission pathway, via drinking water to farm animals, is highlighted by an arrow. Thinking about your local environment, suggest three more transmission routes that link the environmental compartment and the other domains shown in Figure 4. Consider transmission both to and from humans and animals. If you can, print a PDF copy of Figure 4 so that you can draw in your own arrows.

Discussion
There are many possible pathways that could be found in Figure 4; some will be more important than others in your particular setting. Almost any suggestion is correct! Some examples the course authors thought of are as follows:
- AMR can be introduced from humans and animals to the environment through:
- human wastewater or wastewater from animal industries entering waterways
- human or animal waste being used for fertilising agricultural fields.
- AMR can be transmitted from the environment to humans through:
- drinking water
- recreation in water
- contact with water for household purposes or during floods
- contaminated food, e.g. vegetables.
- AMR can be transmitted from the environment to animals through:
- drinking water
- contaminated feed, e.g. vegetables.
Now let’s look more specifically at the impact on and of humans in the environment.
3 Humans and the environment: exposure and exacerbation
In this section you will take a deeper look at the ways in which humans and animals can be exposed to antibiotic resistance in the environment, and how the presence of AMR in the environment can be impacted through human activities.
3.1 Assessment of human exposure to antimicrobial resistance in the environment
In Section 2 you learned about some transmission routes from the environment to humans, among them the intake of contaminated drinking water and washing/recreation in surface water.
How important are these routes of exposure in practice? In this section you will be introduced to the concept of exposure assessment. The extent of exposure through different transmission routes depends on two factors:
- the concentration of resistant bacteria or ARGs in that compartment (the specific part of the environment where AMR can exist and be transmitted)
- the amount of that compartment that is taken up into the human body.
Together, these factors define the dose that is ingested (taken up through the mouth) or inhaled (taken up through air), according to the equation:
D = c × V
where D = dose, c = concentration of resistant bacterium/ARG in the compartment and V = volume ingested or inhaled per time unit through contact with that compartment.
You can see an example of the calculation of the dose of Extended Spectrum Beta Lactamase (ESBL) producing E. coli bacteria ingested during bathing in the extended learning section of the course.
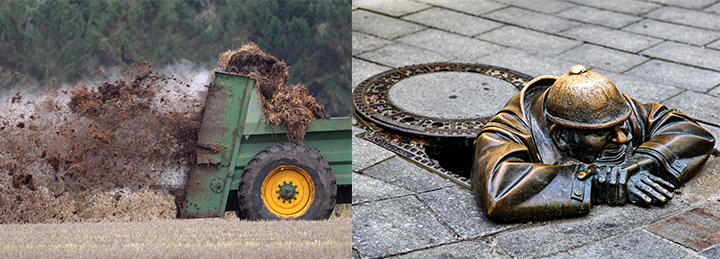
There are some people whose occupations mean that they are particularly exposed to resistant bacteria through contact with the environment. These include, workers involved in sludge treatment or farmers/agricultural workers in contact with animal manure (Figure 5). For example, farmers who have direct contact with farmed animals can have a higher than usual prevalence of resistant bacteria because they are in regular and intensive contact with the animals that carry these bacteria (Van Cleef et al. 2015). Likewise, people who work in close contact with human wastewater or human sewage sludge are likely to have a high exposure to AMR bacteria present in faeces. Research studies of such occupationally exposed populations can demonstrate the existence of a particular transmission route.
In the environmental sector there are very few systematic studies of transmission through specific routes. In the next activity you will look at one particular study.
Activity 4: A study of human exposure to environmental AMR
Read the article ‘Scientists and surfers team up to assess antibiotic resistance’ (ECEHH, 2015) and answer the following questions in the space below:
- According to the article, which AMR indicator is being studied?
- Which transmission route and population are being investigated?
- What is the approach used to investigate whether this transmission route leads to human exposure?
- Do you think this study would be representative of the likelihood of (recreational) water users being colonised with this bacterium in your region as well? Why?
Discussion
- This study investigates a particular resistant bacterium: namely, E. coli bacteria resistant to third- and fourth-generation cephalosporins.
- The study investigates recreation (surfing) in bathing waters in England and Wales as a transmission route for these resistant strains of E. coli.
- The evidence consists of a comparison of the frequency that this bacterium is found in the guts of surfers and people who do not surf (the control group). Surfers are significantly more likely to carry third- and fourth-generation cephalosporin-resistant E. coli in their guts: about three times as frequently as in the control non-surfers.
- Whether this study would be representative of your region mainly depends on the concentrations of resistant E. coli that surfers would encounter, and also the overall prevalence of resistant E. coli in the general population.
You may want to read the full scientific study that this article was based on: ‘Exposure to and colonisation by antibiotic-resistant E. coli in UK coastal water users: environmental surveillance, exposure assessment, and epidemiological study (Beach Bum Survey)’ (Leonard et al., 2018).
3.2 Human activities that affect resistance in the environment
In Section 2 you learned about many processes that lead to introducing resistant bacteria or ARGs from humans or animals into the environment.
Human activities can also introduce antibiotic residues into the environment. Residues of antibiotics are small amounts of antibiotics or their breakdown products that are present in pharmaceutical, human or animal waste after production or use of antibiotics. (You will learn more about residues later in the course.)
Many transmission processes are affected by how sanitation – the treatment of human excrement – is managed. Therefore, there is a strong linkage between AMR in the environment and the concept of water, sanitation and hygiene (WaSH). (If you are interested in learning more about WaSH you may be interested in The Open University’s OpenWASH modules.)
Sanitation
Human faecal waste can be handled in different ways, ranging from open defecation through usage of pit latrines or septic tanks, to flushing to sewer pipes with subsequent treatment in wastewater treatment plants.
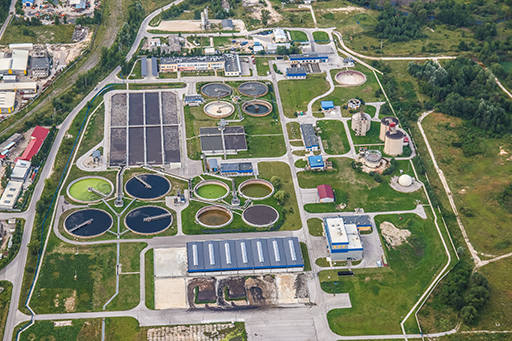
An overview of the state of sanitation in participating countries is reviewed in the WHO/UNICEF Joint Monitoring Programme for Water Supply, Sanitation and Hygiene (JMP) (n.d.). Some types of wastewater treatment – most importantly wastewater treatment plants (WWTPs), such as the example in Figure 6 – have been investigated in detail with respect to their effect on the discharge of resistant bacteria and pollutants. Generally, WWTPs considerably reduce the amount of faecal bacteria and ARGs released to the receiving surface waters. Often, they reduce their concentrations a hundredfold – that is, an efficiency of >99 per cent. (An optional activity on the calculation of the effectiveness of WWTPs is available in the extended learning section of the course.)
However, concentrations of bacteria and ARGs in
You can explore sanitation data for your country in the optional activity in the extended learning section of the course.
There have been a number of studies on the effectiveness of WWTPs; however, there is much less information on the role that non-improved sanitation plays in the spread of resistance. Most importantly, leaking pit latrines and septic tanks can be sources of resistance contaminating the environment, including groundwater and nearby surface waters, especially under conditions of heavy rain. Heavy rainfall can also disrupt the functioning of WWTPs, leading to ‘stormwater’ discharge – that is, the release of untreated raw wastewater into water bodies.
Healthcare in hospitals
Hospitals are a specific point source of AMR because antibiotics are commonly used in hospitals, and patients can carry or be infected with resistant bacteria that are then excreted in the faeces (Figure 7).
Activity 5 What’s in hospital wastewater?
Which of the following agents would you expect to be at a higher concentration in hospital wastewater compared to wastewater from the general population (municipal wastewater)?
- antibiotic-resistant bacteria
- fungi resistant to fungicides
- antibiotics
- biocidal cleaning agents
- antifungals
- ARGs.
Answer
In fact, all these agents can have higher concentrations in hospital wastewater, as demonstrated in a study by Hassoun-Kheir et al. (2020). This is of particular concern if the wastewater is released without treatment to surface waters that humans have direct contact with. As you read above, treatment of wastewater can reduce concentrations of ARGs and also of all the other agents listed above, but concentrations are often not reduced to zero.
Use of wastewater and sludge in agriculture
Of importance for the environment is the use of treated and untreated wastewater, or of surface water contaminated with wastewater, for irrigation of agricultural crops. While water scarcity (which can be increased by climate change) aggravates the need for additional water sources, wastewater use in agriculture poses risks to human health.
Furthermore, biosolids or sludge – the thickened remnant of human waste after treatment in WWTPs, pit latrines or septic tanks – can contain resistant bacteria and ARGs. Sludge is often used as fertiliser to increase agricultural production. Sludge contains human pathogens so it should be treated before application, for example in sludge treatment plants. Treatment can also reduce the release of AMR to agricultural soils.
The role of pharmaceutical manufacturing
Pharmaceuticals, including antibiotics, are produced in manufacturing plants (Figure 8). The production waste may contain relatively high concentrations of antibiotics. Waste is discharged to the environment; if not treated properly, it can result in environmental contamination.

In the next section you will explore the effects of antibiotics on the environment.
4 Terrestrial and aquatic animal farming, and its role in environmental AMR contamination
Besides human waste, animal waste is also a source of antibiotic resistant bacteria, ARGs and antibiotics in the environment. Revisit the course Antimicrobial resistance in animals for a reminder of the causes, presence and effects of antimicrobial usage in animals.
Animal manure is used as fertiliser to increase agricultural production. This practice can increase the level of AMR in soils, at least temporarily. Heavy rainfall can wash resistant bacteria, antibiotics and ARGs off soils into rivers. The use of antibiotics in
5 Antibiotics and other agents: selection of resistance in the environment
Antibiotics and other pollutants can reach the environment via the pathways noted in Sections 3.2 and 4 (human waste, animal waste and waste from pharmaceutical production). This pollution can affect AMR in different ways:
- The presence of some pollutants can exert a selection pressure on environmental bacteria and promote the emergence of new forms of resistance.
- Residues of antibiotics can select for resistant bacteria and therefore increase the concentration of resistant bacteria compared to susceptible bacteria (Bengtsson-Palme and Larsson, 2016).
Selection of resistant bacteria over their non-resistant counterparts can happen at concentrations of antimicrobials well below the concentrations at which they affect growth in classical laboratory assays (such as minimal inhibitory concentration (MIC) testing) – that is, at sub-MIC concentrations (Gullberg et al., 2011).
The exact concentrations at which selection can happen are still not fully known, though estimates have been made (Bengtsson-Palme and Larsson, 2016) and experimentally verified for a couple of antibiotics. For many antibiotics, concentrations in the environment, such as in rivers, are generally lower than the concentrations at which selection of resistance could be expected. However, in certain compartments – most notably raw human wastewater and waste from pharmaceutical manufacturers – the concentrations of specific antibiotics are probably high enough to select for resistant bacteria.
6 Introduction of new resistance combinations from environmental reservoirs
There is an enormous diversity of bacteria in the environment. Mechanisms to resist environmental bacteriocides (compounds naturally produced by microorganisms to give them a competitive advantage) were already present in bacteria long before humans evolved. Therefore, environmental bacteria represent a reservoir for mechanisms of antibiotic resistance (Martínez, 2008). Environmental bacteria can possess genes that encode resistance to antibiotics on their chromosomes. Because most bacteria are not pathogenic, this does not in itself represent a direct risk to humans; however, through horizontal gene transfer – see the course Introducing antimicrobial resistance for more details – these resistance mechanisms can be transferred between different bacterial species, including into animal and/or human pathogens.
This process is much more frequent if the resistance mechanisms are located within a mobile genetic element (also explored in detail in Introducing antimicrobial resistance). A single animal or human carrying a resistant bacterium or ARG can rapidly spread the resistance within their own environmental compartment.
Understanding the processes and pathways of AMR in the environment highlights the critical need for environmental AMR surveillance to monitor, detect and mitigate emerging resistance. In the next section you’ll take a close look at environmental AMR surveillance.
7 Environmental AMR surveillance
Environmental surveillance of AMR refers to ongoing collection, analysis, interpretation and dissemination of data related to AMR in various environmental compartments.
Globally, AMR surveillance in animals and humans provides early warning about the spread of new resistant strains of bacteria, revealing trends and outbreaks of infection.
AMR surveillance is critical to tackling AMR because the data it yields:
- can help to inform the best treatment and care (the right drug at the right dosage for the right amount of time) for humans or animals at a local level, even where it is not possible to test individually
- informs intervention priorities and helps to identify gaps in service delivery at regional and national levels
- guides planning and resource allocation at a national level, and informs policies and responses to patterns and trends.
As you are hopefully realising by studying this course, the environment plays an important role in the introduction and transmission of AMR in humans and animals, but there is limited data to quantify this role. Environmental surveillance can provide essential information to further understand the role of the environment in AMR.
Some aspects of environmental surveillance are similar to surveillance in humans and animals; some are a little different. Environmental surveillance of AMR has not been taking place for as long as human and animal surveillance: although it is growing in importance, it is still in its early stages, with few formalised systems or large-scale implementation projects. Environmental surveillance activities are often still limited to certain locations or specific research studies rather than continuous monitoring across regions.
Activity 6: Where should environmental surveillance be carried out?
Use the space below to make a list of specific places (compartments) in the environment where you think it might be useful to monitor for antimicrobials, resistant bacteria or ARGs.
Discussion
The authors of this course thought of the following environmental compartments that could be monitored – you may have thought of others depending on your own setting:
- raw sewage/untreated wastewater
- treated wastewater
- agricultural soil (e.g. after fertilisation)
- drinking water
- bathing water
- river water
- irrigation water
- air.
Scientific studies on AMR in the environment have so far been performed in all types of surface water, coastal water, (manured) soil, wastewater and air. All these pilot studies and smaller initiatives are important to collect necessary information on AMR in the environment.
In the following sections you will look at surveillance in these compartments in more detail.
7.1 Wastewater surveillance
Untreated wastewater or sewage surveillance is probably the best known and most well studied and documented form of environmental surveillance.
Although it is often considered under the umbrella of environmental surveillance, wastewater monitoring is a special case because its purpose is almost always to show trends of AMR or particular pathogens in the human community. Therefore, it is also a form of human surveillance rather than purely environmental surveillance.
Untreated wastewater or sewage surveillance refers to the monitoring and analysis of water that flows from households, industries and other sources into sewage systems or wastewater treatment facilities. This type of surveillance is used to detect and monitor various biological and chemical markers such as pathogens (bacteria, parasites, viruses), pollutants (including pharmaceuticals) and/or specific ARGs. This means that wastewater contains important information about health, lifestyle and, potentially, the environmental impact of a community.
Example: AMR surface water in Malaysia
A study looked at the occurrence of ESBL coliforms, carbapenem-resistant bacteria (CRB) and total coliforms in river water (Ott et al., 2021). Coliforms are a group of Gram-negative non-spore forming bacteria (such as E. coli and Klebsiella) that are often used as faecal contamination indicators. CRBs are bacteria resistant to last resort antibiotics such as carbapenem and can lead to pneumonia or bloodstream infections that are very difficult to treat.
The study demonstrated that:
- these factors are measurable outside the laboratory in ‘real-world’ conditions
- differences in their concentration over place (rural and urban) and time (wet and dry season).
Study Figure 9, which shows some of the study’s findings. The graph shows the concentrations of coliforms, ESBL-producing coliforms and carbapenem-resistant bacteria at different sampling locations along rivers in Malaysia. The sampling locations are shown on the map.
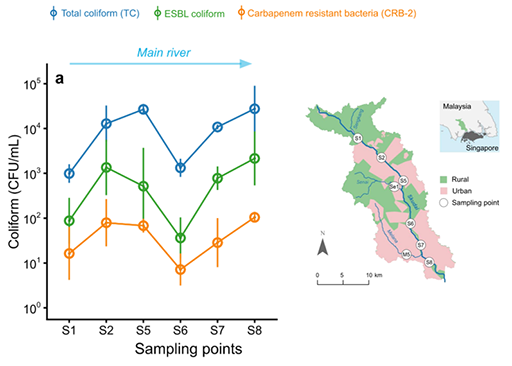
Looking at the graph and the map in Figure 9, can you think of a reason for the differences you see between the sampling points?
Answer
The relationships between total coliforms, ESBL and CRBs remain similar at all the sampling points. However, looking at the overall trends, it is clear that values are lower at S1 and S6. The map suggests that the concentrations of all the measurements are low at S1 because areas upstream of the sampling point are mainly rural, with little human waste entering the river. The same explanation holds for the values at S6, where the area immediately upstream is also rural. As such, at these sampling points less human wastewater enters the river compared to the urban areas represented by S2, S5, S7 and S8.
7.2 Examples of surveillance of AMR in water
Next you will look at an example of water surveillance. Two more examples are included in the extended learning section of the course. These examples do not cover all aspects and all compartments, but should give you an idea of the different aspects, objectives and targets that may be included in AMR surveillance in an environmental compartment.
The examples of AMR surface water in Malaysia and in the extended learning section contribute to a better understanding of AMR transmission to and from the environment. They also suggest the best ways of setting up environmental surveillance, but there remain many knowledge gaps about the roles of the environment and environmental surveillance in AMR.
What do you think was the objective of the example of AMR surface water in Malaysia?
Answer
The objective was to monitor AMR in river water to determine sources of emission and variation over seasons.
If you have read the examples in the extended learning section, the objectives of these studies were to:
- monitor AMR in drinking water to identify sources of human exposure and provide data for risk assessment of drinking water (Example 1)
- monitor antibiotic residue trends and identify gaps in prescription administration and monitoring (Example 2).
7.3 Environmental surveillance for other purposes
Much can be learned about environmental surveillance from other disciplines, such as monitoring of chemical and pharmaceutical environmental pollution. For some of these product groups a much longer history of environmental surveillance activities exists and the output of these studies has resulted in regulations, for example the Water Framework Directive in Europe (European Commission, n.d.). Surveillance activities are often undertaken by environmental laboratories that are well acquainted with chemical analysis and sometimes also have tasks in drinking water/surface water quality control through measuring indicators for faecal pollution.
These regulations compel member countries to carry out surveillance of surface water to assure water quality and human and ecological health. A list of priority substances is drafted that must be monitored.
8 Why carry out environmental surveillance?
AMR surveillance in the environment can take many forms, involving different compartments and different techniques, and is often complex and potentially a resource-intensive task – so having well-defined objectives clarifies what specific outcomes are needed. This in turn guides the design of the study. Setting clear objectives is vital to ensure that the surveillance process is focused, meaningful and effective.
The different possible overall objectives of surveillance are similar across One Health domains. Specifically, the four overall objectives for surveillance (including environmental surveillance) are to:
- determine trends of AMR
- determine emerging forms of AMR
- generate data contributing to exposure assessments of AMR
- determine the efficiency of interventions.
These overall objectives can be narrowed down to more specific sub-objectives and tailored to the environmental context. You will consider the four overall objectives, written more specifically for the environment, in the following sections.
8.1 Determine trends of AMR in the environment or wastewater
Insights into temporal and spatial presence of AMR in an environmental compartment will emerge by following AMR trends like the ones shown in Figure 10. For example:
- surveilling the presence of AMR in surface water over time to provide information on sources of emission of AMR into this surface water
- surveilling the circulation of uncommon ARGs in human populations over time through raw wastewater measurements; this can be used as a proxy for human surveillance and is a cheaper and easier option – it is often called ‘wastewater-based surveillance’ or also occasionally ‘environmental surveillance’, although the goal is to provide information on AMR in the human population rather than in the environment.

8.2 Determine emerging forms of AMR in environmental compartments and/or hotspots
By measuring AMR in environmental compartments or hotspots such as WWTPs, it is possible to keep track of emerging resistant microbes or emerging resistance mechanisms. Emerging means newly increasing or upcoming.
These could develop in the environment through transmission of naturally occurring ARGs into pathogenic bacteria, including under the selection pressure of antibiotic residues or heavy metals. (Heavy metals can also have antimicrobial properties. ARGs can be co-selected by heavy metals if resistance genes for antimicrobials and heavy metals reside in identical pieces of DNA).
8.3 Generate data contributing to risk/exposure assessments of AMR
By monitoring AMR in environmental compartments that humans or animals are exposed to, data can be produced to feed into risk assessments associated with these exposures – for example, by monitoring AMR in:
- drinking or bathing water
- (waste) water used for crop irrigation.
8.4 Determine the efficiency of interventions
This is carried out through monitoring in the environment before and after initiating interventions such as sewage/wastewater treatment or manure treatment.
These were the four objectives of environmental surveillance of AMR.
Remember that surveillance systems or other studies of AMR in the environment can have more than one objective.
8.5 Identifying project objectives
The objectives in Sections 8.1–8.4 generate information supporting human and animal health.
Identifying trends in public health-relevant resistant pathogens in sewage, or assessing the efficacy of an intervention to reduce the emission of AMR to the environment are ways to reduce the chance of exposure of humans and animals to AMR pathogens. Measuring AMR in an environmental compartment is important to unravel the complex issues of AMR and lower the burden of disease in humans and animals. To get the results you need, the project objectives should be specific and achievable.
Activity 7: Setting objectives
Think back to the list that you made in Activity 6 of the environmental compartments that could be monitored for AMR.
Add these compartments to the table in this template. For each compartment, think of a possible study area that you might explore within that compartment, and complete the table by adding a possible overall objective for each combination – pick one or more from:
- determining trends of AMR
- determining emerging forms of AMR
- generating data contributing to exposure assessments of AMR
- determining the efficiency of interventions.
Discussion
Table 1 shows some reasonable study areas and possible objectives for the compartments identified by the course authors in Activity 6. This doesn’t mean that other answers are wrong; it all depends on the context.
| Compartment | Study area | Objective(s) |
|---|---|---|
| Raw sewage/untreated wastewater | Pathogen of low prevalence with public health concern | Determining trends (in humans) |
| Raw sewage/untreated wastewater | Concerns about new forms of resistance | Identifying emerging forms |
| Untreated and treated wastewater | Questions about wastewater treatment interventions | Determining the efficacy of intervention |
| Agricultural soil | Concerns about dissemination of AMR by fertilising with manure | Determining trends in AMR |
| Drinking water | Questions about treatment options | Determining the efficacy of intervention |
| Drinking water | Concerns about public health | Producing data for risk assessment |
| River water | Attribution of urban and agricultural sources to river concentrations; role of residues for selection of AMR | Determining trends in AMR |
| Irrigation water (and irrigated crops) | Questions about irrigations with wastewater | Producing data for risk assessment/determining the efficacy of intervention |
| Air | Concerns about occupational exposure of farmers | Producing data for risk assessment |
9 Designing an environmental AMR surveillance methodology
The design of any study is highly dependent on the objective of the study or surveillance activity. Designing a study on AMR in the environment requires careful planning to ensure that the relevant data is collected and meaningful conclusions can be drawn. Many of the aspects of planning are similar to other AMR study designs such as identification of sampling locations, drafting protocols, logistic planning, lab preparations, and a data analysis plan.
Note that in time- and resource-tight times, collaborating with other initiatives is very useful. Environmental surveillance for other indicators (chemical, pharmaceutical or microbiological) might already be going on, and using their infrastructure could be helpful in saving time and resources.
In the following sections you will touch upon two aspects specific to measuring AMR in the environment: the metrics of surveillance and the AMR indicators. You can look at another aspect, the place and time of sampling, in the extended learning section of the course.
9.1 Metrics of environmental AMR surveillance
Quantifying AMR in environmental water, soil and air samples requires specific methods to assess the presence and concentration of resistant microbes or ARGs.
For human and animal surveillance, AMR outcomes are often presented as prevalences; for example, the percentage of patients or farms that are positive for a specific pathogen, or as descriptions of a panel of minimum inhibitory concentrations (MICs) determined for an isolate using antimicrobial susceptibility testing.
For environmental compartments, concentrations are often used to quantify AMR in a sample. Concentrations can generally be measured for bacteria using culture-based methods, and for ARGs by techniques such as quantitative polymerase chain reaction (qPCR). When using metagenomic techniques (such as whole genome sequencing [WGS]) that are used to analyse the genetic material from environmental samples, the data is expressed as relative concentration (in terms of gene composition) but generally not absolute concentration (in terms of gene concentration per amount of environmental sample).
In the following sections you will look at the metrics for all compartments with a special focus on water, as this is the most researched compartment. Note that if you are unfamiliar with culture-based techniques or qPCR methodologies you should refer to the courses Isolating and identifying bacteria (human health), Isolating and identifying bacteria (animal health), Testing for mechanisms of resistance and Whole genome sequencing in AMR surveillance.
Water
The metric for assessing contamination of water quantitatively is the number of bacteria or genes in a litre (1000 ml) of water. Alternatively, the percentage of ESBL-producing E. coli as a proportion of all E. coli cultured can be measured, or the relative composition of all ARGs in a metagenomic analysis.
Water samples, especially wastewater samples, often contain a high concentration of human waste, representing the output from many individuals. This means that samples are often positive for the indicator of interest: that is, at least one or a few bacteria are present in every sample. This means it is common to end up with all the samples positive (100 per cent). This is not a useful number for making comparisons between samples, following trends or determining the efficiency of any intervention. Therefore, quantitation in samples is done by determining the concentration of a specific bacterium; for example, the percentage of ESBL-producing E. coli of all E. coli present or the number of ESBL-producing E. coli in a litre of water.
Water is a commonly used environmental sample for analysis. However, laboratories that usually work on human and animal surveillance might not have experience in processing water samples; similarly, laboratories working on water samples might not have experience in AMR testing. Good communication can overcome these weaknesses.
You can read more about collecting soil and air samples and the associated metrics in the extended learning section of the course.
9.2 AMR indicators
For example, when monitoring trends in humans using untreated sewage, the focus may be on detecting resistant pathogens that are of low prevalence in humans but of high public health relevance. In contrast, when evaluating the effectiveness of an intervention, indicators must be measurable at all times – even if the immediate public health relevance is of less importance. Of course, the indicator of choice is also dependent on the laboratory capacity present in the region, or whether qPCR or sequencing facilities are available or not.
Some studies on AMR in the environment measure genes using qPCR and metagenomics (such as WGS) rather than using culture techniques and quantifying live bacteria. Compared to human and animal surveillance, environmental research more often addresses specific ARGs or metagenomic analyses; however, if the surveillance activity is to support human or animal health, or if the aim is to integrate analyses from different surveillances, choosing an indicator that is meaningful for the human or animal health sectors often means considering culturing and counting bacteria as well.
A common indicator
E. coli is a common indicator of (animal or human) faecal contamination in water and soil (Anjum et al., 2021), and can also harbour ARGs.
The presence of resistant E. coli can be used as a proxy and indicates the presence of (faecal) resistant organisms from human or animal sources. It is also a good candidate for measuring the same microbe across the human, animal and environment sectors, as it is already an established AMR indicator in human and animal health. Because of this, methods for its isolation are often familiar and many protocols exist (Figure 11). On the other hand, focusing on just a single bacterium has the disadvantage that ARGs present in other species are overlooked. This means that analyses of E. coli are not representative of the whole bacterial community.

Activity 8: Selecting indicators
In this activity you will extend the table that you started in Activity 7. An updated version of the table appears in this template with an additional two columns.
Once you have copied in the information from the table in Activity 7, begin this activity by adding any possible AMR indicators that you can think of to the fourth column. Once you have done this, decide if you think these studies on AMR in the environment are suitable for regular surveillance or are research studies, and indicate your answer in the final column.
Discussion
Table 2 shows some possible objectives and indicators. However, your answers will depend on the compartments you have selected and the context that you are working in. Whether or not an indicator is useful for regular surveillance depends to a large extent on cost and the local laboratory testing capacity.
| Compartment | Study area | Objective(s) | AMR indicator(s) | Suitable for regular surveillance? |
|---|---|---|---|---|
| Raw sewage/untreated wastewater | Pathogen of low prevalence with public health concern | Determining trends (in humans) | CPE, ESBL, VRE, fluoroquinolone resistant salmonella (indicators WHO bacterial pathogen list) | Yes |
| Raw sewage/untreated wastewater | Concerns about new forms of resistance | Identifying emerging forms | Resistance genes | Yes |
| Untreated and treated wastewater | Questions about wastewater treatment interventions | Determining the efficacy of intervention | E. coli, ESBL, ARGs | Possible, but more suited to research study |
| Agricultural soil | Concerns about dissemination of AMR by fertilising with manure | Determining trends in AMR | Resistance genes | Yes |
| Drinking water | Questions about treatment options | Determining the efficacy of intervention | Faecal indicators (E. coli) | Yes – depending on the average drinking water quality, it might be more suited to research study |
| Drinking water | Concerns about public health | Producing data for risk assessment | E. coli, ESBL | Yes |
| River water | Attribution of urban and agricultural sources to river concentrations; role of residues for selection of AMR | Determining trends in AMR | AMR indicators or residues | Yes |
| Irrigation water (and irrigated crops) | Questions about irrigations with wastewater | Producing data for risk assessment/determining the efficacy of intervention | E. coli, ESBL-producing E. coli | Possibly, but more suited to research study |
| Air | Concerns about occupational exposure of farmers | Producing data for risk assessment | MRSA, ARGs | More suited to research study |
10 Integrated surveillance
Surveillance efforts are usually focused on activities within one sector (human, animal or the environment).
Integrated surveillance involves the systematic collection, analysis and sharing of data on AMR across multiple interconnected domains, including human, animal, the environment and food. It recognises the shared nature of antimicrobial use and resistance across these sectors, and seeks to provide an understanding of AMR dynamics and transmission pathways.
As you have seen, this is the concept of a One Health approach recommended by the Quadripartite organisations. Integrated One Health surveillance comprises a coordinated unifying approach across sectors regarding:
- sampling sources
- AMR indicators
- sampling design
- laboratory methods
- data management
- data analysis
- reporting.
Using a collaborative approach, sectors can learn from each other’s knowledge and methods, support each other’s messages to the public and policymakers, and create common goals in the fight against AMR. Combining data from animal, human and the environmental sectors can provide evidence for sources of AMR and transmission routes. An important precondition for close collaboration between domains, sectors and disciplines is trust and sharing a common language (jargon). Establishing this takes energy and time.
Environmental surveillance (almost) never stands on its own. One environmental compartment is always connected to other domains, and almost all the work conducted during environmental surveillance is to (eventually) support human and animal health. Integration of surveillance activities and collaboration should be core activities for those working on environmental surveillance.
One example of an integrated surveillance protocol is called Tricycle, and you’ll look at that next.
10.1 Tricycle
Tricycle, as illustrated in Figure 12, is a standardised global surveillance approach designed by WHO to monitor the prevalence and spread of ESBL-producing E. coli across the One Health sectors: humans, animals (livestock) and the environment. The protocol focuses on ESBL-producing E. coli because of its high clinical relevance, its role as an indicator organism and its ability to spread between domains.
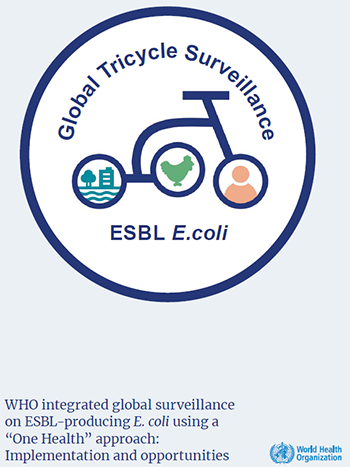
The aim of the Tricycle protocol is to provide countries with a common, simplified and integrated multisectoral surveillance system to detect, and then estimate the prevalence of ESBL-producing E. coli in humans, animals (livestock) and the environment. For these specific goals the protocol gives detailed advice about sampling locations and procedures. Remember that:
- occurrence of ESBL-producing E. coli in wastewater can give information about its prevalence in the general human population
- occurrence of ESBL-producing E. coli in surface water can be relevant for exposure.
Sampling of surface water reflects the sources of ESBL-producing E. coli and its prevalence. Therefore, sampling locations should be near:
- human waste emissions, e.g. city waterways (canals, rivers, etc.) or wastewater treatment plants
- animal waste emissions, e.g. wastewater from wet markets/slaughterhouses.
Sampling of surface water also reflects the environment and possible exposure for humans. Therefore, sampling locations should be selected carefully and include controls, such as:
- rivers, before (upstream) and after (downstream) human and animal contamination
- drinking water (a recent extension – protocol development is underway).
Besides environmental sampling of surface water, the Tricycle protocol includes human sampling, including a hospital patient population (such as those positive for a blood stream infection) and a community population (such as healthy pregnant women). It also addresses food animal sampling by including poultry (chicken) caecal samples from fresh carcasses at wet markets and/or slaughterhouses.
In the following activity you will look at an example of how the Tricycle protocol has been used in practice.
Activity 9: An example application of the Tricycle protocol
Read the following summary of a Tricycle study in Madagascar, in which the ESBL-producing E. coli isolates were subsequently subjected to WGS to allow comparison with each other (Milenkov et al., 2024 ). (WGS and its use in AMR surveillance is explained further in the course Whole genome sequencing in AMR surveillance.)
When you have read the summary, answer the following questions:
- Are nearly identical ESBL-producing E. coli found in the three different sectors?
- Does this finding prove that exposure through (a) animals and (b) the environment contributes to human ESBL carriage?
The researchers implemented the Tricycle protocol in Madagascar to assess ESBL-producing E. coli prevalence and describe intrasector and intersector circulation of ESBL-producing E. coli and plasmids. In their prospective study, the researchers collected blood culture data from hospitalised patients with a suspected bloodstream infection and rectal swabs from healthy pregnant women from three hospitals in Antananarivo, Madagascar. They also collected caeca from farm chickens, water from the Ikopa river, wastewater and slaughterhouse effluents in the same area.
In total 1056 blood cultures were collected, and 289 pregnant women, 246 chickens and 28 surface waters were sampled. All the samples were tested for ESBL-producing E. coli and the genomes of all isolates were sequenced, characterised and compared.
Of the blood cultures, 18 contained E. coli, of which seven (39%) were ESBL. ESBL-producing E. coli was present in samples from 86 (30%) of 289 pregnant women, 140 (57%) of 246 chickens and 28 (100%) of 28 surface water samples. When the researchers looked at the DNA from 277 bacterial samples they found a great deal of variety: 90 different types. However, some bacteria were shared between two or even three of the compartments, with similar plasmids carrying the ARGs being found in all three compartments.
The researchers found that:
- ESBL-producing E. coli strains and plasmids were circulating among humans, chickens and the environment in Antananarivo, Madagascar
- the Tricycle protocol can be implemented in a low-income country, where it represents a powerful tool for investigating dissemination of AMR from a One Health perspective.
Answer
- Yes: genetically similar ESBL-producing E. coli were found in all three sectors.
- No, you cannot conclude anything about directionality. The epidemiological design of the sampling protocols was neither intended nor sufficient for attribution of dissemination from one sector to another, such as from animals to humans and vice versa. Repeated over time, however, trends in ESBL-producing E. coli resistance in each sector would provide strong evidence for the magnitude of selection pressure applied in each sector and, in combination with molecular characterisation, may provide evidence for directionality of flows of resistance elements among sectors.
You can read the full Tricycle report with detailed protocols for the full study (WHO, 2021). Optionally, you may like to see if you can complete the first four columns of the table from Activity 8 for the three compartments in the Tricycle project (humans/patients, animals [chicken carcass] and surface water). You could use another copy of the table template from Activity 8 if you’d like to complete this activity, but note that this is not a formal part of your study on this course.
Other initiatives
As well as Tricycle, other collaborative initiatives are ongoing at the time of writing this course in 2025. You can find out more about these by following the links in the further resources section at the end of this course.
11 AMR and the environment in your work
You should now have a better understanding of the role of the environment in AMR and have a flavour of the complexity of environmental monitoring. Before you finish this course you should complete this final activity, which will help you to consolidate what you have learned.
Activity 10: AMR in the environment in your work
Part 1
Revisit Figure 4 (repeated below), which you first met at the beginning of this course. You should now be able to add to your work in Activity 3 and identify many more transmission routes.
12 End-of-course quiz
Well done – you have reached the end of this course and can now do the quiz to test your learning.
This quiz is an opportunity for you to reflect on what you have learned rather than a test, and you can revisit it as many times as you like.
Open the quiz in a new tab or window by holding down ‘Ctrl’ (or ‘Cmd’ on a Mac) when you click on the link.
13 Summary
In this course you have learned about the role of the environment in the emergence and transmission of AMR. You have learned about the processes involved in the development and transmission of AMR in the environment and how this is linked with human and animal health. You have learned about the value of wastewater treatment, and how wastewater and other environmental compartments can be surveilled to reveal trends in AMR. You have also learned the importance of correct surveillance methodology, and how environmental surveillance protocols are being established.
You should now be able to:
- explain how AMR emerges and is maintained in the environment, and how it is transmitted and spread within the environment and between the environment, humans and animals
- illustrate the main ways by which human activities, including animal husbandry, exacerbate AMR in the environment and how these could be managed
- explain the consequences of AMR organisms and mobile AMR genes in the environment
- demonstrate awareness of the links between AMR and pollution and waste
- explain the purpose(s) of environmental AMR-related surveillance and its importance as part of the One Health multisectoral approach to addressing AMR
- outline environmental surveillance methodologies
- explain what factors need to be considered when designing/implementing AMR-related surveillance in the environment
- describe an example of how environmental surveillance can be integrated with human and animal surveillance as part of a One Health approach.
Now that you have completed this course, consider the following questions:
- What is the single most important lesson that you have taken away from this course?
- How relevant is it to your work?
- Can you suggest ways in which this new knowledge can benefit your practice?
When you have reflected on these, go to your reflective blog and note down your thoughts.
Activity 11: Reflecting on your progress
Do you remember at the beginning of this course you were asked to take a moment to think about these learning outcomes and how confident you felt about your knowledge and skills in these areas?
Now that you have completed this course, take some time to reflect on your progress and use the interactive tool to rate your confidence in these areas using the following scale:
- 5 Very confident
- 4 Confident
- 3 Neither confident nor not confident
- 2 Not very confident
- 1 Not at all confident
Try to use the full range of ratings shown above to rate yourself:
When you have reflected on your answers and your progress on this course, go to your reflective blog and note down your thoughts.
14 Your experience of this course
You’ve now reached the end of this course. If you’ve enrolled on a pathway, please go back to the pathway page and tick the box to confirm that you’ve completed this course. On the pathway page you’ll see both your progress so far as well as the other courses you need to complete in order to achieve your Certificate of Completion for that pathway.
Now that you have completed this course, take a few moments to reflect on your experience of working through it. Please complete a survey to tell us about your reflections. Your responses will allow us to gauge how useful you have found this course and how effectively you have engaged with the content. We will also use your feedback on this pathway to better inform the design of future online experiences for our learners.
Many thanks for your help.
Further resources
You might be interested in other collaborative initiatives related to environmental and integrated AMR surveillance:
- WHONET: Free software developed by WHO for managing and analysing microbiology lab data, especially for AMR surveillance.
- InFARM: (FAO, n.d.) The International FAO AMR Monitoring system, a global platform created by the FAO for collecting and analysing AMR data in food and agriculture.
- Codex Alimentarius: AMR (FAO/WHO, n.d.): Joint FAO/WHO standards and guidelines on AMR in the food chain.
- Tricycle protocol (WHO, 2021): A One Health (WHO, n.d. 2) surveillance protocol focusing on ESBL-producing E. coli across humans, animals and the environment.
- Bracing for Superbugs (UNEP, 2023): A comprehensive UNEP report on environmental dimensions of AMR and the need for action.
- Soil sampling standards (ISO, n.d.): The ISO 18400 series provides guidelines for soil sampling relevant for environmental AMR studies.
- GLOWACON (EC, 2024): A global consortium for wastewater and environmental surveillance for public health.
- EU-JAMRAI: A European joint action to combat AMR through a One Health approach.
- EU-WISH: Focuses on strengthening wastewater surveillance for public health across Europe.
References
Alawi, M., Smyth, C., Drissner, D., Zimmerer, A., Leupold, D., Müller, D., Do, T.T., Velasco-Torrijos, T and Walsh, F. (2024) ‘Private and well drinking water are reservoirs for antimicrobial resistant bacteria’, Antimicrobials and Resistance, 2, 7.
Anjum, M.F., Schmitt, H., Börjesson, S and Berendonk, T.U. (2021) ‘The potential of using E. coli as an indicator for the surveillance of antimicrobial resistance (AMR) in the environment’, Current Opinion in Microbiology, 64, pp. 152–8.
Bengtsson-Palme, J. and Larsson, D.G.J. (2016) ‘Concentrations of antibiotics predicted to select for resistant bacteria: proposed limits for environmental regulation’, Environment International, 86, pp. 140–49.
D’Costa, V.M., King, C.E., Kalan, L., Morar, M., Sung, W.W.L., Schwarz, C., Froese, D., Zazula, G., Calmels, F., Debruyne, R., Golding, G.B., Poinar, H.N. and Wright, G.D. (2011) ‘Antibiotic resistance is ancient’, Nature, 477, pp. 457–61 [online]. Available at https://doi.org/10.1038/nature10388 (accessed 1 August 2025).
European Centre for Environmental & Human Health (ECEHH) (2015) ‘Scientists and surfers team up to assess antibiotic resistance’, University of Exeter Medical School (8 June). Available at: https://www.ecehh.org/news/beach-bums/ (accessed 13 August 2025).
European Commission (EC) (2024) ‘Launching GLOWACON: a global initiative for wastewater surveillance for public health’, news announcement, 21 March [online]. Available at https://health.ec.europa.eu/latest-updates/launching-glowacon-global-initiative-wastewater-surveillance-public-health-2024-03-21_en (accessed 1 August 2025).
European Commission (n.d.) ‘Water Framework Directive’ [online]. Available at https://environment.ec.europa.eu/topics/water/water-framework-directive_en (accessed 1 August 2025).
Food and Agriculture Organization of the United Nations (FAO) (n.d.) ‘InFARM system’ [online]. Available at https://www.fao.org/antimicrobial-resistance/resources/infarm-system/en/ (accessed 1 August 2025).
Food and Agriculture Organization of the United Nations/World Health Organization (FAO/WHO) (n.d.) ‘Antimicrobial resistance’, Codex Alimentarius [online]. Available at https://www.fao.org/fao-who-codexalimentarius/thematic-areas/antimicrobial-resistance/en/ (accessed 1 August 2025).
Gullberg, E., Cao, S., Berg, O.C., Ilbäck, C., Sandegren, L., Hughes, D. and Andersson, D.I. (2011) ‘Selection of resistant bacteria at very low antibiotic concentrations’, PLOS Pathogens, 7, e1002158.
Hassoun-Kheir, N., Stabholz, Y., Kreft, J.-U., de la Cruz, R., Romalde, J.L., Nesme, J., Sørensen, S.J., Smets, B.F., Graham, D. and Paul, M. (2020) ‘Comparison of antibiotic-resistant bacteria and antibiotic resistance genes abundance in hospital and community wastewater: a systematic review’, Science of the Total Environment, 743, 140804.
Holton, E., Louw, C., Archer, E., Louw, T., Wolfaardt, G. and Kasprzyk-Hordern, B. (2023) ‘Quantifying community-wide antibiotic usage via urban water fingerprinting: focus on contrasting resource settings in South Africa’, Water Research, 240, 120110.
International Organization for Standardization (ISO) (n.d.) ‘Soil quality’ [online]. Available at https://www.iso.org/sectors/environment/soil-quality (accessed 1 August 2025).
Leonard, A.F.C., Zhang, L., Balfour, A.J., Garside, R., Hawkey, P.M., Murray, A.K., Ukoumunne, O.C. and Gaze, W.H. (2018) ‘Exposure to and colonisation by antibiotic-resistant E. coli in UK coastal water users: environmental surveillance, exposure assessment, and epidemiological study (Beach Bum Survey)’, Environment International, 114, pp. 326–33. Available at https://doi.org/10.1016/j.envint.2017.11.003 (accessed 13 August 2025).
Martínez, J.L. (2008) ‘Antibiotics and antibiotic resistance genes in natural environments’, Science, 321, pp. 365–7.
Milenkov, M., Proux, C., Rasolofoarison, T.L., Rakotomalala, F.A., Rasoanandrasana, S., Rahajamanana, V.L., Rafalimanana, C., Ravaoarisaina, Z., Ramahatafandry, I.T., Westeel, E., Petitjean, M., Berti, V., Marin, J., Mullaert, J., Han, L., Clermont, O., Raskine, L., Endtz, H., Andremont, A., Denamur, E., Komurian-Pradel, F., Samison, L.H. and Armand-Lefevre, L.(2024) ‘Implementation of the WHO Tricycle protocol for surveillance of extended-spectrum β-lactamase producing Escherichia coli in humans, chickens, and the environment in Madagascar: a prospective genomic epidemiology study’, The Lancet Microbe, 5.
Mosaka, T.B.M., Unuofin, J.O., Daramola, M.O., Tizaoui, C. and Iwarere, S.A. (2023) ‘Inactivation of antibiotic-resistant bacteria and antibiotic-resistance genes in wastewater streams: current challenges and future perspectives’, Frontiers in Microbiology, 13.
Ott, A., O’Donnell, G., Tran, N.H., Haniffah, M.R.M., Su, J.-Q., Zealand, A.M., Gin, K.Y.-H., Goodson, M.L., Zhu, Y.-G. and Graham, D.W. (2021) ‘Developing surrogate markers for predicting antibiotic resistance “hot spots” in rivers where limited data are available’, Environmental Science & Technology, 55, pp. 7466–78.
Torsvik, V., Øvreås, L. and Thingstad, T.F. (2002) ‘Prokaryotic diversity – magnitude, dynamics, and controlling factors’, Science, 296(5570), pp.1064–66.
van Cleef, B.A.G.L., van Benthem, B.H.B., Verkade, E.J.M., van Rijen, M.M.L., Kluytmans-van den Bergh, M.F.Q., Graveland, H., Bosch, T., Verstappen, K.M.H.W., Wagenaar,J.A., Bos, M.E.H., Heederik, D. and Kluytmans, J.A.J.W. (2015) ‘Livestock-associated MRSA in household members of pig farmers: transmission and dynamics of carriage, a prospective cohort study’, PLoS ONE, 10(5), e0127190. doi:10.1371/journal.pone.0127190.
United Nations Environment Programme (UNEP) (2023) Bracing for Superbugs: Strengthening Environmental Action in the One Health Response to Antimicrobial Resistance. Geneva: UNEP [online]. Available at https://www.unep.org/resources/superbugs/environmental-action (accessed 1 August 2025).
WHONET, https://whonet.org/ (accessed 1 August 2025).
WHO/UNICEF Joint Monitoring Programme for Water Supply, Sanitation and Hygiene (JMP) (n.d.) ‘Data’ [online]. Available at https://washdata.org/data/household#!/ (accessed 4 August 2025).
World Health Organization (WHO) (2021) WHO Integrated Global Surveillance on ESBL-producing E. coli Using a ‘One Health’ Approach: Implementation and Opportunities, 16 March. Geneva: WHO [online]. Available at https://www.who.int/publications/i/item/9789240021402 (accessed 1 August 2025).
World Health Organization (WHO) (n.d. 1) ‘One Health’ [online]. Available at https://www.who.int/health-topics/one-health#tab=tab_1 (accessed 7 August 2025).
World Health Organization (WHO) (n.d. 2) ‘One Health: integrated multi sector surveillance’ [online]. Available at https://www.who.int/initiatives/glass/glass-modules-7 (accessed 1 August 2025).
Acknowledgements
This free course was collaboratively written by Heike Schmitt, Roosmarijn Luiken, Hilary MacQueen and Dawn Harmon, and reviewed by Michael Macey, Will Gaze, Stanley Fenwick and Rachel McMullan.
Except for third party materials and otherwise stated (see terms and conditions), this content is made available under a Creative Commons Attribution-NonCommercial-ShareAlike 4.0 Licence.
The material acknowledged below is Proprietary and used under licence (not subject to Creative Commons Licence). Grateful acknowledgement is made to the following sources for permission to reproduce material in this free course:
Images
Figure 1a: Christo Ras/Pixabay
Figure 1b: Robert Balog/Pixabay
Figure 1c: hartono subagio/Pixabay
Figure 1d: Peter H/Pixabay
Figure 2: BrianAJackson/Getty
Figure 3: eufic
Figure 5a: Pete/Pixabay
Figure 5b: Vladi Alon/Alamy
Figure 6: Michal Jarmoluk/Pixabay
Figure 7: Pixabay
Figure 8: Yogendra Singh/Pixabay
Figure 9a: taken from Ott et al. (2021)
Figure 10: taken from Remschmidt, C., Schröder, C., Behnke, M., Gastmeier, P., Geffers, C. and Kramer, T. (2018) ‘Continuous increase of vancomycin resistance in enterococci causing nosocomial infections in Germany – 10 years of surveillance’, Antimicrobial Resistance & Infection Control, 7; DOI 10.1186/s13756-018-0353-x
Figure 11: Hans Newman/microbiologyinpictures.com
Figure 12: World Health Organization; this file is licensed under the Creative Commons Attribution-Non-commercial-Share Alike Licence https://creativecommons.org/licenses/by-nc-sa/3.0/igo/deed.en