
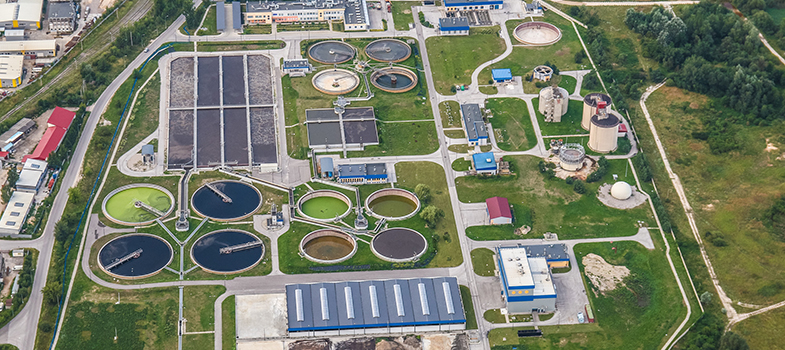
7.1 Wastewater surveillance
Untreated wastewater or sewage surveillance is probably the best known and most well studied and documented form of environmental surveillance.
Although it is often considered under the umbrella of environmental surveillance, wastewater monitoring is a special case because its purpose is almost always to show trends of AMR or particular pathogens in the human community. Therefore, it is also a form of human surveillance rather than purely environmental surveillance.
Untreated wastewater or sewage surveillance refers to the monitoring and analysis of water that flows from households, industries and other sources into sewage systems or wastewater treatment facilities. This type of surveillance is used to detect and monitor various biological and chemical markers such as pathogens (bacteria, parasites, viruses), pollutants (including pharmaceuticals) and/or specific ARGs. This means that wastewater contains important information about health, lifestyle and, potentially, the environmental impact of a community.
Example: AMR surface water in Malaysia
A study looked at the occurrence of ESBL coliforms, carbapenem-resistant bacteria (CRB) and total coliforms in river water (Ott et al., 2021). Coliforms are a group of Gram-negative non-spore forming bacteria (such as E. coli and Klebsiella) that are often used as faecal contamination indicators. CRBs are bacteria resistant to last resort antibiotics such as carbapenem and can lead to pneumonia or bloodstream infections that are very difficult to treat.
The study demonstrated that:
- these factors are measurable outside the laboratory in ‘real-world’ conditions
- differences in their concentration over place (rural and urban) and time (wet and dry season).
Study Figure 9, which shows some of the study’s findings. The graph shows the concentrations of coliforms, ESBL-producing coliforms and carbapenem-resistant bacteria at different sampling locations along rivers in Malaysia. The sampling locations are shown on the map.
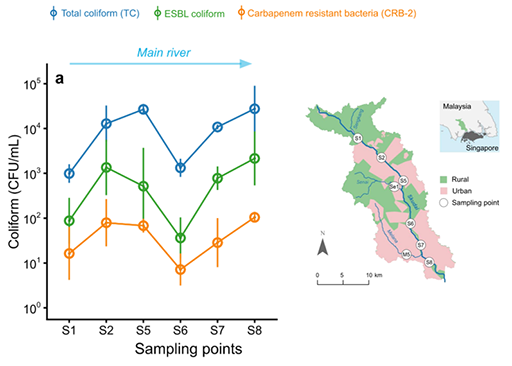
Looking at the graph and the map in Figure 9, can you think of a reason for the differences you see between the sampling points?
Answer
The relationships between total coliforms, ESBL and CRBs remain similar at all the sampling points. However, looking at the overall trends, it is clear that values are lower at S1 and S6. The map suggests that the concentrations of all the measurements are low at S1 because areas upstream of the sampling point are mainly rural, with little human waste entering the river. The same explanation holds for the values at S6, where the area immediately upstream is also rural. As such, at these sampling points less human wastewater enters the river compared to the urban areas represented by S2, S5, S7 and S8.
7 Environmental AMR surveillance

