Use 'Print preview' to check the number of pages and printer settings.
Print functionality varies between browsers.
Printable page generated Friday, 19 June 2026, 11:41 PM
Whole genome sequencing in AMR surveillance
Introduction
After completing this course, you will be able to:
- describe the basic principles of WGS
- explain when, how and why WGS is used in AMR surveillance, and how it complements other types of testing and data to strengthen the AMR surveillance system
- give examples of how WGS is used in AMR-related surveillance
- reflect on how increasing WGS capacity could strengthen AMR surveillance in your work
- recognise the cost and economic advantages of WGS for AMR surveillance and understand the barriers to its implementation
- outline what is needed to make the case for increasing WGS capacity in your work.
In order to achieve your digital badge and Statement of Participation for this course, you must:
- click on every page of the course
- pass the end-of-course quiz
- complete the course satisfaction survey.
The quiz allows up to three attempts at each question. A passing grade is 50% or more.
When you have successfully achieved the completion criteria listed above you will receive an email notification that your badge and Statement of Participation have been awarded. (Please note that it can take up to 24 hours for these to be issued.)
Activity 1: Assessing your skills and knowledge
Before you begin this course, you should take a moment to think about the learning outcomes and how confident you feel about your knowledge and skills in these areas. Don’t worry if you do not feel very confident in some skills – they may be areas that you are hoping to develop by studying these courses.
Now use the interactive tool to rate your confidence in these areas using the following scale:
- 5 Very confident
- 4 Confident
- 3 Neither confident nor not confident
- 2 Not very confident
- 1 Not at all confident
This is for you to reflect on your own knowledge and skills you already have.
1 What is whole genome sequencing and how can it be used for AMR surveillance?
In this course you will be introduced to the fundamental concepts of WGS, including commonly used terminology. If you haven’t done so already, it might be helpful for you to review the course Introducing antimicrobial resistance to make sure that you understand what a
So what is WGS?
It’s a laboratory process that determines the complete
1.1 How is WGS relevant to AMR surveillance?
As you may have learned in the course Antimicrobial susceptibility testing, laboratories traditionally use phenotypical testing to determine antimicrobial susceptibility. Laboratories might do additional characterisation of resistance determinants by using, for example,
WGS also offers the ability to conduct many types of analysis from a single

Further advantages of using WGS for AMR surveillance are summarised in Table 1.
| Advantage of WGS | How this helps your AMR surveillance |
|---|---|
| Single laboratory workflow | Reduces time and resources needed to characterise isolates; simplifies laboratory consumables and allows automation for increased efficiency (WHO, 2020) |
| Multiple types of data can be generated from a single sequencing run | Enables simultaneous analysis for bacterial typing, reducing the need for multiple assays |
| Bioinformatic workflows | Standardised workflows increase |
| Broad applicability across pathogens | Detection of many types of microbes, including bacteria, viruses, fungi and parasites; allows co-infection detection and distinction between phenotypically similar strains |
| Easy storage and sharing of data | Facilitates remote collaboration; enables additional analyses without the need to re-culture or transport samples |
| Retrospective analyses | Enable investigation of past outbreaks or re-analysis as new tools/knowledge become available without additional laboratory work |
| High-resolution data | Provide detailed insights that support more informed decisions for infection control, surveillance and outbreak response |
1.2 What can the data produced by WGS tell you?
As noted in the previous section, WGS can produce detailed genetic information that allows for precise identification of resistance genes and mutations (WHO, 2020).
Beyond the complete DNA sequence of the bacterial genome, you can learn a lot more information about bacteria using WGS.
Some WGS data can help you track, monitor and compare bacterial strains across time, location and sectors to understand how infections spread and evolve. This data includes the stages listed below:
- Outbreak origin: WGS can show whether a strain has been seen before and where; this helps to track outbreaks and for you to understand whether the strains are spreading in hospitals, communities or across regions.
- Detect outbreaks early: By comparing WGS data, you can tell if infections from different places are caused by related bacteria – indicating a possible outbreak.
- Monitor what is circulating: WGS helps you to keep track of which bacteria and resistance mechanisms are present in your location over time.
- Linking data across sectors: WGS can link data from animals, food, the environment and humans; this supports a One Health approach to understanding and tackling AMR (WHO, 2020).
- How your results compare to other laboratories: WGS provides standard typing results that can be easily shared and compared to those from other labs and countries.
WGS data can also help you assess the potential impact of a bacterial strain on public health. This data includes the following benefits:
- Treatability: WGS identifies AMR genes and point mutations (resistance determinants) that can be used to predict which antibiotics are likely to work, or not work, against an infection.
- Transferability: WGS shows where resistance determinants are located in the DNA sequence, which can tell you if the resistance mechanism can be transferred to other bacteria; this helps to determine whether the resistance is likely to spread and whether the strain poses a higher risk.
- Severity: Some bacteria can cause more serious disease than others; WGS data can help you to identify the
virulence (disease severity) of bacteria so that you know if it will be more or less harmful to humans or animals.
WGS data can also be used to identify and describe the specific features of the bacteria.
- Prediction of emerging threats: WGS can detect unusual patterns or new combinations of resistance, helping you spot threats before they become widespread.
- Exact type of bacteria: WGS can tell you not just the species, but also the extract type or strain; this helps you to identify who the bacteria might harm and which hosts it could infect (e.g. humans, poultry, cattle) based on how it causes illness.
Activity 2: Types of WGS data
a.
Surveillance and epidemiology
b.
Clinical and public health risk assessment
c.
Pathogen characterisation
The correct answer is a.
a.
Surveillance and epidemiology
b.
Clinical and public health risk assessment
c.
Pathogen characterisation
The correct answer is b.
a.
Surveillance and epidemiology
b.
Clinical and public health risk assessment
c.
Pathogen characterisation
The correct answer is a.
a.
Surveillance and epidemiology
b.
Clinical and public health risk assessment
c.
Pathogen characterisation
The correct answer is a.
a.
Surveillance and epidemiology
b.
Clinical and public health risk assessment
c.
Pathogen characterisation
The correct answer is c.
a.
Surveillance and epidemiology
b.
Clinical and public health risk assessment
c.
Pathogen characterisation
The correct answer is a.
a.
Surveillance and epidemiology
b.
Clinical and public health risk assessment
c.
Pathogen characterisation
The correct answer is b.
a.
Surveillance and epidemiology
b.
Clinical and public health risk assessment
c.
Pathogen characterisation
The correct answer is a.
a.
Surveillance and epidemiology
b.
Clinical and public health risk assessment
c.
Pathogen characterisation
The correct answer is b.
a.
Surveillance and epidemiology
b.
Clinical and public health risk assessment
c.
Pathogen characterisation
The correct answer is a.
You have now been introduced to WGS and its applications. In the next section you will learn more details of its use in AMR surveillance programmes and see several real-life examples of its applications.
2 How is WGS used in AMR-related surveillance?
In this section, you will explore how WGS can be used in AMR surveillance through a few case studies. You will also look at how WGS can be integrated with, or replace, other testing methods.
Please see the course Antimicrobial resistance in animals for more information about integrated surveillance. It might also be helpful to review Introducing AMR surveillance systems for an overview of the relationship between local, regional, national and international AMR surveillance systems.
2.1 What are the main uses of WGS data for surveillance?
The use of WGS for AMR surveillance has grown exponentially since it was introduced in the early 2000s. Public, veterinary and environmental health agencies around the world now use WGS as part of routine surveillance. In the US state of Washington, the Department of Health (DOH) integrated a genomics-first approach into its AMR surveillance system, with the result that it is now better able to identify additional outbreak cases, sensitively classify outbreak or non-outbreak cases, and confirm hypothesised linkages between cases (Torres, et al., 2025). In South Africa, the National Institute for Communicable Diseases conducts WGS-based AMR surveillance with support from the UK Aid Fleming Fund’s SeqAfrica project (DTU National Food Institute, n.d. 1).
Case Study 1 is an example of the use of WGS for AMR surveillance at the national level.
Case Study 1: DANMAP
The Danish Integrated Antimicrobial Resistance Monitoring and Research Programme (DANMAP) integrated WGS into its ongoing surveillance activities to monitor and control AMR starting in 2018. It now uses WGS to:
- improve the detection of resistance genes and mutations in bacterial pathogens
- monitor trends in AMR over time
- investigate and manage outbreaks of resistant infections.
DANMAP is a One Health system that can integrate data from various health registers, thereby connecting genomic data to patient-level metadata, such as hospital records, prescription data and regional food laboratory records and epidemiological information. DANMAP makes use of EPILINX, a visualisation tool that maps patient networks and tracks transmission events during healthcare-setting outbreaks. This tool supports molecular epidemiologists in linking patient movements, risk factors and infection sources through visualisations such as an
DANMAP’s website includes more information about the programme, including previous reports and recordings.
Figure 2 provides a demonstration of how this tool visualises AMR trends over time across different animal and food sources using DANMAP data (DANMAP, 2025).
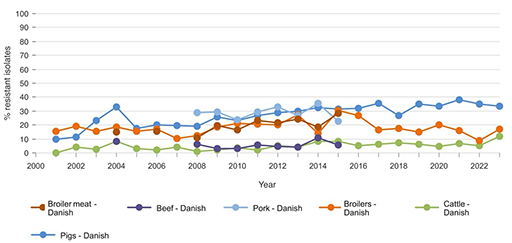
Based on Figure 2, which source has the highest ampicillin-resistant E. coli levels from 2015 onward, and how does this compare to resistance in other livestock groups during that time? What might explain the difference?
Answer
From 2015 onwards, E. coli isolates from Danish pigs show the highest resistance to ampicillin, often exceeding 30%. In contrast, resistance in cattle remains consistently low, generally under 10%. This likely reflects differences in antimicrobial usage between pig and cattle production systems, as well as variation in infection pressure and treatment practices. For broilers, the level is intermediate between that observed in pigs and cattle.
In this section, you have seen examples that illustrate how WGS is transforming AMR surveillance by enabling more precise detection, tracking and response to resistance trends, while also allowing data to be integrated across sectors to follow outbreaks and monitor changes over time, ultimately supporting more effective, data-driven public health interventions.
2.2 How can WGS surveillance supplement phenotypic surveillance?
Phenotypic surveillance is widely used to monitor AMR but often has practical limitations, especially in low-resource settings. Time, cost and infrastructure constraints mean that routine surveillance is often limited to identifying the species,
In most routine surveillance systems, particularly in hospital and veterinary contexts, phenotypic AST continues to serve as the primary method for detecting resistance trends. The data forms the foundation of national and international AMR reporting systems, and is indispensable for tracking resistance prevalence over time.
While WGS offers powerful capabilities, it is not a replacement for phenotypic testing. WGS provides predictions of resistance based on known genes and mutations, but it cannot confirm whether those genetic determinants are expressed or functional. In this sense, WGS is best viewed as a complement to phenotypic surveillance. Phenotypic AST continues to play a critical role in validating genotypic predictions, revealing discrepancies and capturing resistance mechanisms that may not yet be well characterised in genetic databases. That said, phenotypic AST is not without its own limitations: it can miss low-level resistance and may be affected by test conditions.
As sequencing technologies advance, a genomic era is being entered where WGS is increasingly taking the lead in AMR surveillance. It offers the ability to detect a broad range of resistance genes, uncover transmission dynamics and generate detailed data from a single assay. While WGS is not yet ready to replace phenotypic testing for decisions about clinical treatment, it is already transforming how AMR is detected, understood and monitored. In the future, phenotypic testing may take on a more selective role, serving primarily as a confirmatory tool to support increasingly comprehensive genomic approaches.
Here’s how WGS adds value.
- Addressing limitations of routine testing: As described above, WGS provides more detailed information than standard tests, making it easier to spot new threats and understand how resistance spreads – saving time and enabling consistent, scalable surveillance across settings.
- Improving the accuracy of resistance detection: A
concordance study has shown that WGS can be more accurate than phenotypic AST – especially where testing quality is inconsistent or performance varies (Rebelo et al., 2025). - Detecting clinically relevant resistant genes: One of the biggest concerns in AMR surveillance is that most resistance genes affect how bacteria respond to treatment; by detecting these genes, WGS can indicate real clinical risk, making it a powerful tool for early warning systems and timely public health action.
- Explaining unusual phenotypic results: WGS can reveal mutations or resistance mechanisms that explain unexpected AST results, such as resistance without an obvious gene or vice versa.
- Enabling tracking and prediction: WGS can spot signs of antibiotic resistance before they show up in standard laboratory tests, helping track how resistance spreads between people, animals and the environment, and catching new threats early.
Having seen a summary of how WGS adds value to surveillance systems, Case Study 2 highlights some of the real-life benefits.
Case Study 2: ESBL-producing E. coli in Nigerian abattoirs: the added value of WGS
By combining tests for phenotypic antimicrobial susceptibility with WGS, Aworh and colleagues achieved a more holistic understanding of AMR dynamics at the human-animal-environment interphase. Their research, which was conducted in two major Nigeria abattoirs, investigated the prevalence and genetic characteristics of extended-spectrum ß-lactamase-producing Escherichia coli (ESBL-EC) in humans, cattle and environmental samples (Aworh et al., 2022). One example of their data is shown in Figure 3.
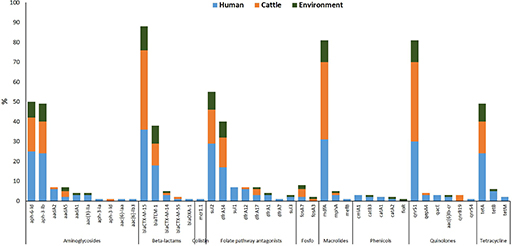
What does Figure 3 tell you about how resistance genes such as blaCTX-M-15 or sul1 are distributed across humans, cattle and the environment?
(Sul1 is a sulphonamide resistance gene; blaCTX-M-15 is an extended-spectrum β-lactamase [ESBL] resistance gene.)
Answer
Figure 3 shows that some resistance genes, like blaCTX-M-15 and sul1, are found in E. coli isolates from all three sources: humans, cattle and the environment.
What kind of insight does WGS provide in this example that would not be visible from phenotypic testing alone?
Answer
This suggests that these genes may be circulating between sectors, pointing to possible transmission routes or shared reservoirs of resistance.
WGS allows researchers to detect the exact genes responsible for resistance, something that phenotypic testing alone cannot do. While phenotypic testing can show resistance to a drug class, it cannot reveal whether the same gene is present in different sources or how widespread it is. This genetic detail helps build a clearer picture of how resistance spreads and supports targeted public health interventions.
Phenotypic testing of samples revealed high levels of multidrug resistance, while WGS provided deeper insights into the genetic mechanisms underpinning resistance. WGS identified the widespread presence of key resistance genes, clonal relationships and gene transfer among isolates. The study also highlighted abattoir workers as a high-risk group for faecal carriage of ESBL-EC.
These findings underscore the importance of a One Health approach and demonstrate how genomic tools can enhance surveillance, inform risk assessment and support evidence-based policy decisions such as regulating antimicrobial use in livestock and improving hygiene practices in abattoirs.
What was one key benefit of using WGS as described in Case Study 2?
Answer
WGS added value by revealing the genetic mechanisms behind antibiotic resistance in E. coli found in humans, cattle and the environment. It identified key resistance genes, showed how the bacteria were related, and provided evidence of gene transfer between bacteria – insights that phenotypic testing alone could not provide. This helped highlight abattoir workers as a high-risk group and supported the need for better hygiene and antimicrobial use policies.
2.3 How WGS compares with standard approaches
Molecular testing refers to techniques such as PCR (polymerase chain reaction) that detect specific resistance genes or mutations at the genetic level. PCR is a method used to amplify small segments of DNA, allowing the detection of even low levels of a resistance gene in a sample. Unlike phenotypic AST, which tests whether bacteria can grow when exposed to antibiotics, molecular methods look for specific resistance genes in the bacteria’s DNA. This means they can detect resistance even if it’s not currently causing a problem.
Molecular tests are often used to confirm the presence of specific resistance genes; for example, following phenotypic detection of AMR. However they can only detect what they are designed to target, so may miss novel or unexpected resistance mechanisms.
To better appreciate the pros and cons of the three main different approaches to AMR screening, Table 2 shows a comparison between AST, molecular testing and WGS.
| Feature | Phenotypic tests (AST) | Molecular tests | WGS analysis |
|---|---|---|---|
| What is measured? | Bacterial growth in the presence of antibiotics | Whether specific resistance genes are present | All the genetic information, including all resistance genes |
| Main methods | Sequencing machines and bioinformatic software | ||
| Main outcomes | Shows which antibiotics the bacteria are resistant to | Shows known resistance genes | Lists all resistance genes, mutations and other information such as plasmid types and |
| Detects actual resistance? | Yes | No, only predicts based on genes | No, only predicts based on genes |
| Identifies specific resistance genes? | No | Yes, but only the ones you look for | Yes, all known genes in the genome |
| Identifies resistance mutations? | No | Sometimes | Yes, all known ones |
| Detects plasmids? | Sometimes, limited to methods | Sometimes, limited to methods | Yes |
| Identifies strain typing and epidemiology? | Yes, with some laboratory methods | Yes, if specific tools are used | Yes, very detailed and automated |
| Identifies serotypes and pathotypes? | Yes, via specific laboratory tests | Yes, via PCR | Yes |
| Detects unknown mechanisms? | Sometimes | No | Not without extensive analysis; without it, it only finds known resistance gene/mutations |
| Detects virulence? | Yes, with laboratory tests | Yes | Yes |
| Turnaround time | 1–3 days | 1–2 days | 1–5+ days (depending on sequencing technology) |
| Infrastructure needed? | Microbiology lab: incubator, media, antibiotic disks or strips, and tools for measuring growth (e.g. spectrophotometer or visual reading) | Molecular biology lab: PCR machine (thermocycler), gel electrophoresis equipment and reagents for extracting and amplifying DNA; Sanger sequencing | Sequencing machine and software, bioinformatic tools; requires a DNA extraction set-up, a sequencing machine (e.g. Illumina or Oxford Nanopore) and computers with specialised software for genome analysis; also needs trained staff for both laboratory and data analysis |
| Scalability | Low to moderate | Moderate | High |
| Use in surveillance | Mostly used in clinical settings; provides baseline resistance trends and prevalence data | Used in some labs; detects known genes in targeted surveillance | Widely used for AMR and outbreak surveillance; offers high-resolution data for source-tracking and resistance mechanisms |
Activity 3: Reflecting on your experience
Use the space below to spend a few minutes noting which approaches and tests shown in Table 2 you are familiar with and are used in your area; these might be in local hospitals or other regional surveillance centres.
How many of these involve molecular-based tests? You will see later why this can be an important factor when considering the introduction of WGS approaches to surveillance.
Discussion
The approaches and tests that you have noted will depend upon your setting and context. If you’re not sure what types of tests are used in your area, you might like to discuss this with colleagues.
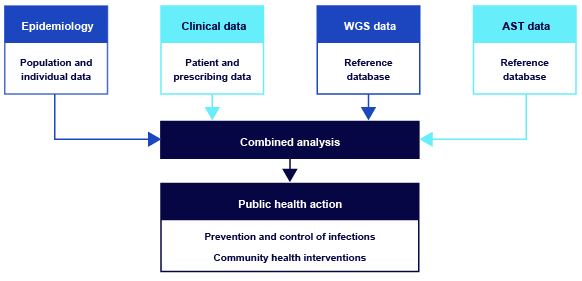
2.4 Linking data to action
When it’s combined with epidemiological, clinical and AST data, WGS data can be integrated through analysis to guide effective public health actions. Figure 4 illustrates the importance of linking diverse data sources to produce meaningful, actionable insights.
To finish this section, complete Activity 4.
Activity 4: Comparing phenotypic tests and WGS
a.
True
b.
False
The correct answer is a.
a.
True
b.
False
The correct answer is b.
a.
True
b.
False
The correct answer is b.
a.
True
b.
False
The correct answer is b.
a.
True
b.
False
The correct answer is b.
a.
True
b.
False
The correct answer is b.
a.
True
b.
False
The correct answer is a.
a.
True
b.
False
The correct answer is a.
a.
True
b.
False
The correct answer is a.
a.
True
b.
False
The correct answer is b.
b.
It typically requires simpler laboratory equipment such as incubators and antibiotic disks.
Having seen how WGS technology compares to existing surveillance approaches, the next section will focus on the specifics of the processes and discuss practical laboratory aspects to consider.
3 What is needed to conduct WGS of AMR in your laboratory?
Based on what you have learnt in the previous sections about the advantages of WGS for AMR surveillance, you might be considering introducing WGS for your country or region’s AMR surveillance.
Activity 5: Reflection
You reflected on the current approaches to testing used in your area after studying Table 2. Now take a few minutes to reflect on your own plans for introducing or building WGS capacity in your context. Are you considering using WGS? If so, what motivates you? Think about a specific challenge or issue you are facing in your institution or country. How would WGS help you deal with this challenge? You may want to use the space below for your notes.
Discussion
You’ve made a thoughtful start by reflecting on your plans for introducing or building WGS capacity. As you continue the course, keep thinking about how to align your motivations with practical steps for implementation, especially in light of any constraints on resources or infrastructure that you may face. If you have doubts about what is possible in your context, now might be a good time to discuss this question with colleagues.
Introducing WGS can be a complicated process; you must consider various factors. This section will help you consider how you might apply WGS in your own work. It starts by reviewing the process of conducting WGS, including the equipment and tools needed, from DNA extraction to data analysis. By the end of this section, you should understand the essential components required to establish an AMR WGS surveillance facility.
An overview of the four main stages of WGS is shown in Figure 5.
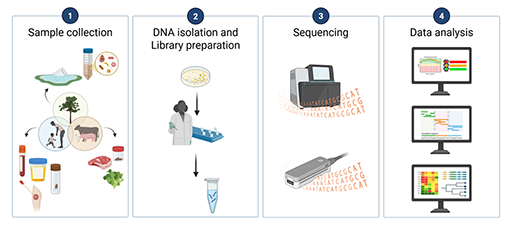
Each of the four stages is discussed in more detail in the following sections. Data sharing and infrastructure considerations are also discussed. The specific steps in each stage are tailored to whether you are conducting short or long read sequencing. Important aspects that need to be considered in planning are noted in the next sections.
3.1 Sample collection
As with phenotypic surveillance, the first step in conducting WGS is sample collection.
When you collect a sample for WGS, you will need to ensure that relevant
It is important to collect metadata at the time of sampling, as it will be critical for interpreting your results later and for further analysis. Metadata provides the context needed to interpret WGS data and is key to turning it into meaningful public health or research insights. For more information on the importance of metadata for analysis of AMR patterns and trends you may like to visit the Gender and equity in AMR surveillance course.
Once you have collected your samples, you will need to decide which ones to sequence. Sample selection for WGS can be a complicated topic, as explained below.
- Sequencing is much more costly than typical phenotypic methods, so you may not be able to sequence every isolate.
- You may want to prioritise what you sequence, perhaps by ensuring that you sequence samples from a wide geographic area in your surveillance zone.
- You might want to randomise which isolates are sequenced to understand prevalent genotypes.
- A good sample selection strategy will need to be part of your plan for using WGS in your AMR surveillance.
For more information on this topic, you can watch a webinar produced by the Fleming Fund’s SeqAfrica project, ‘How to decide what to sequence’.
3.2 DNA isolation and library preparation
As in phenotypic surveillance, you’ll begin wet-laboratory work for WGS by culturing your samples. However, the next steps will differ somewhat from the usual microbiology laboratory work. For WGS, laboratory technicians must conduct DNA extraction, where cells from a pure culture are broken to isolate the DNA, and proteins and cell debris are removed.
You should also measure the extracted DNA (quantitation) to make sure that you have the specific volume and amount of DNA needed for the library preparation step that follows.
The next step in preparing for sequencing in the laboratory is called
3.3 Sequencing
This stage involves loading your DNA library into the sequencing machine and running the appropriate sequencing software to determine the sequence of DNA. The basic unit of DNA is a
Two approaches to WGS are commonly used:
- Second-generation (short read) sequencing produces short reads (DNA fragment sequences) (50–500 base pairs) by running many reactions at once.
- Third-generation (long read) sequencing uses newer methods to read much longer stretches of DNA.
Each technology has its own advantages and limitations; Table 3 has a detailed comparison of them.
| Point of comparison | Short-read sequencing | Long-read sequencing |
|---|---|---|
| Sample commercial machines | 454 Roche, Ion Torrent, Illumina | PacBio, Oxford Nanopore |
| Read length (i.e. the size of the DNA fragments – longer reads simplify post-processing and analysis) | Short pieces of DNA (about 50–500 base pairs long) | Long pieces of DNA (up to thousands or even millions of base pairs long) |
| Accuracy | Currently has higher accuracy, generating higher-quality sequences | Lower accuracy but better resolution of complex regions |
| Applications | Finding genetic mutations Microbiome and AMR studies Targeted gene testing Outbreak and AMR surveillance; however, may miss structural variations or struggle with repetitive regions | WGS Complete genome assembly Detecting large genetic changes, gene arrangements and mobile elements Plasmid detection Real-time outbreak and AMR surveillance Mobile/field-based testing |
| Cost and speed | High initial equipment cost Lower per-sample cost when run at scale Best for large batches May have slower turnaround in low-volume setting | Lower upfront equipment cost Higher per-sample cost Ideal for small batches or rapid response Faster turnaround for fewer isolates |
| Institutional considerations | Larger machines suitable for centralised facilities High throughput and cost-efficient when used fully | Portable machines (e.g., MinION) Enables decentralised or field-based sequencing Real-time sequencing, quick turnaround time |
| Number of isolates that can be sequenced in one run | Depends on the platform used but typically ranges from around 80–100 isolates on a MiSeq up to 700–900 on a NextSeq, and as many as 2500–3500 on a NovaSeq | 12–24, depending on the flow cell and kit being used |
For short-read sequencing, Illumina machines are the most widely used machines in all genomics work. There is a wide range of Illumina machines (Figure 6), with varying prices and specs. As an example, a SeqAfrica partner laboratory in Ghana purchased an Illumina Nextseq 1000, including freight, installation and training for around £186,000 (2023).
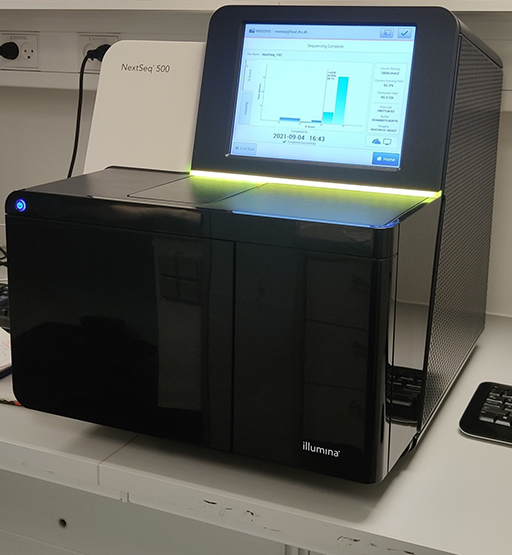
Video 1 shows how an Illumina workflow functions.
Oxford Nanopore Technologies (ONT) produces the most used long-read sequencing devices. A Nanopore MinION Mk1D pack including sequencing consumables and five MinION Flow Cells cost around £3600 in 2025. As seen in Figure 7, the MinION is a portable real-time sequencing device.
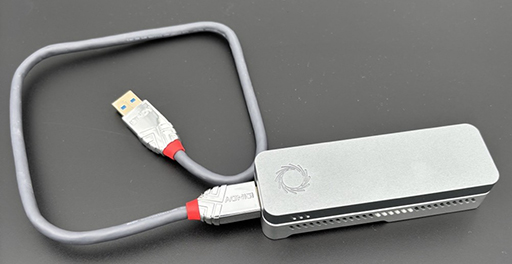
The MinION device needs to be connected to a PC or laptop (for field-based analysis) to run and collect data. Oxford Nanopore Technologies’ website includes a video of how nanopore sequencing works.
For both types of sequencing, the companies produce a variety of machines, each with different levels of accuracy and potential throughput.
3.4 Data analysis
After the sequencing is completed, the machine returns DNA fragment sequences (‘reads’) that can be analysed on a computer.
Can you recall the two types of sequencing machines in common use, based on
Answer
How do the sequences generated by these two systems compare with regard to quality?
Answer
Short-read sequences are more accurate, but the less accurate long-reads are better for resolving complex regions of the genome.
Before further analysis, a quality control (QC) step ensures that only
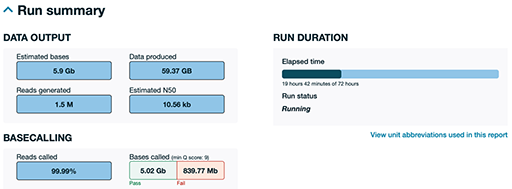
The sample portion of a QC report generated by ONT during a sequencing run shown in Figure 8 was generated about 19 hours into a 72-hour run. This is just a portion of a much larger report to give you a sense of how an ONT run report looks. As can be seen, the system has produced approximately 60 gigabytes (GB) of raw data. You can see that 99.99% of the sequence has been successfully read as base pairs (reads called), with only a tiny percentage being highlighted as a fail. This is only a partial run; ONT runs typically generate even more data if allowed to complete the full 72 hours. ONT provides detailed, real-time QC to help users monitor yield, quality and run progress at any time.
Once the high-quality data is ready, it is analysed using specialised software. This can be done by trained bioinformaticians, but there are also free, cloud-based platforms available that make analysis more accessible, especially for smaller labs or public health institutions.
The next steps depend on the type of sequencing that has been performed, as detailed below.
- With short-read data, the DNA fragments are usually compared to the sequence of a known
reference genome . This helps to identify DNA sequence differences between your sample and known strains, such as changes that may affect resistance to antibiotics, how the bacteria are spreading or how they may have evolved. - With long-read data, the software often builds the sequence of the genome from scratch – a process called
genome assembly . This approach is especially good for detecting plasmids,mobile resistance genes and parts of the genome that are difficult to analyse using short-read technologies. Plasmids and mobile resistance genes are important because they often carry AMR genes and can move between bacteria. This means they can spread resistance not just within one species but across different species and environments. Being able to detect and track these elements helps us understand how resistance is spreading and where interventions may be needed.
After the reads are mapped or assembled into a full genome, the sequences can be uploaded by the users to a trusted international database such as ResFinder, CARD (The Comprehensive Antibiotic Resistance Database), and VFDB (The Virulence Factor Database), where the reads are compared to existing genomes already in the database to see how closely related they are. This is important for tracking outbreaks, understanding how resistance is spreading, and identifying the likely source of an infection.
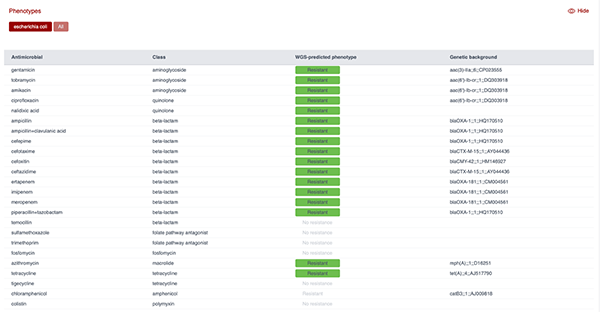
Figure 9 shows the AMR profile predicted from the genome of an E. coli isolate using the ResFinder tool. As can be seen, the panel lists antimicrobials screened, their class, the predicted resistance phenotype based on WGS and the genetic background (i.e. the resistance gene detected). This output demonstrates how WGS can be used to predict resistance to multiple antibiotic classes and link phenotypes to specific genetic determinants.
While this course focuses on sequencing from cultured isolates, another emerging approach is
Activity 6: The four stages of WGS
Drag and drop the four stages of WGS described above into the correct order.
Two lists follow, match one item from the first with one item from the second. Each item can only be matched once. There are 4 items in each list.
Sample collection
DNA isolation and library preparation
Sequencing
Data analysis
Match each of the previous list items with an item from the following list:
a.2
b.3
c.4
d.1
- 1 = d,
- 2 = a,
- 3 = b,
- 4 = c
3.5 Data-sharing considerations
After your data has been analysed, your next task is to ensure that the information you’ve gathered is used within your public, veterinary and/or environmental health systems.
If you suspect an outbreak or emerging threat, you might need to take immediate public health action based on your results. This could involve alerting a local hospital, a disease-control agency or government health department. You may have findings that should be shared with policy-makers. More information about using data for action in AMR can be found in the course Using AMR data for policy-making.
From a systemic surveillance perspective, you will need to ensure that you comply with national reporting guidelines and follow privacy and confidentiality protections related to data-sharing. Please also see the course Legal and ethical considerations in AMR data for more information on legal and ethical considerations related to data-sharing.
As previously mentioned, one of the advantages of WGS is that the data can be re-analysed at a future time if you have a new question or emerging issue. Therefore, you will want to ensure that you save the raw data, your analysis, your comprehensive metadata and the genome in a secure, accessible and well organised location.
Can you think of a situation when re-analysing data generated from a sample could prove useful?
Answer
You might want to reanalyse data if:
- a new resistance gene is discovered and you want to check whether it was already present in past samples
- a new outbreak is detected and you want to see whether either (a) the older sample has any genetically related strains or (b) the outbreak strain was circulating earlier
- you want to assess historical trends related to a pathogen when a new and improved
bioinformatics tool becomes available and you think you can discover new information.
You can consider saving the data in a public repository such as the National Center for Biotechnology Information (NCBI)’s GenBank, the European Nucleotide Archive (ENA) or the DNA Data Bank of Japan (DDBJ). These repositories are part of international data-sharing networks that ensure your sequencing data can be accessed by researchers and public health agencies worldwide. Sharing data publicly supports global efforts to monitor AMR, detect emerging threats and respond quickly to outbreaks. It also allows your data to be reused for future studies, making your contribution more impactful.
You could also consider using a commercial cloud service or local storage such as a
3.6 Infrastructure considerations
Establishing a WGS facility requires you to consider whether the existing infrastructure you have is suitable.
Which of the four stages of WGS could potentially require dedicated infrastructure and high capital investment?
Answer
The most likely are the wet-lab processes (a laboratory facility for sample culture, DNA isolation, quantitation and library preparation), DNA sequencing (a laboratory facility and instrumentation), and data analysis.
As part of the planning process, suitable facilities will need to be put in place for these stages.
In addition to laboratory space, when establishing a WGS centre it’s essential to ensure reliable power and internet access to avoid costly disruptions during sequencing and analysis. If power is interrupted during an Illumina run, the sequencing process usually cannot be resumed, often resulting in the loss of reagents and the need to restart the entire run. By contrast, Oxford Nanopore Technologies (ONT) runs can sometimes be paused and resumed, depending on the set-up and software version. Continuous power is also important for keeping reagents and samples refrigerated or frozen.
Similarly, during the data-analysis phase, internet connectivity plays a key role. Cloud-based platforms such as BaseSpace or Epi2Me depend on uninterrupted internet access to function properly: if the connection is lost, the analysis may stall or fail. However, local tools and offline workflows (e.g. command-line pipelines) can typically continue running without internet access, provided the required data and tools are already downloaded.
Another critical infrastructure consideration is data storage (Figure 10). Especially when it is done at scale, sequencing generates large volumes of data that must be securely stored and managed.

As an example of the storage requirements, sequencing a single E. coli isolate typically produces around 250–500 MB of data with short-read machines like Illumina, and approximately 150–300 MB with long-read machines like ONT. Even though ONT reads are much longer, fewer are needed to sequence a genome, so the total amount of data generated can be smaller than with short-read technologies.
Both machines generate additional files during downstream analysis, such as assemblies and resistance-gene reports, that can quickly consume terabytes of space when processing large numbers of samples. Institutions may choose between cloud storage (for flexibility and scalability) or local servers (for faster access and better control – especially in low-bandwidth environments).
You’ll also need to consider the computational resources required for data analysis. Web-based tools like EPI2ME, BaseClear and PathogenWatch are user-friendly and require minimal local computing power, making them ideal for beginners or low-resource settings. However, more advanced or large-scale tasks (e.g. genome assembly, variant detection or AMR surveillance) require a high-performance computer with a strong processor, sufficient RAM and ample hard drive space.
Careful planning across power supply, internet connectivity, data storage and computing capacity is essential to build efficient, scalable and sustainable WGS operations, particularly in resource-limited settings.
Activity 7: Reflection on infrastructure needs for establishing a WGS lab
Look at the questions in Table 4 to help you reflect on your laboratory’s readiness for introducing WGS. (You may want to use the space below to make notes.)
| Question | Reflection prompts |
|---|---|
| Do I have consistent power and internet access? | If not, can I supplement with back-up solutions like uninterruptible power supplies (UPS) or generators? Can I install a redundant internet line or use local/offline tools when needed? |
| Where will I store my sequence and analysis data? | Are there any legal or policy restrictions on using cloud storage in my country or region? Do I need to invest in local servers with back-up? |
| How intensive will my data analysis be? | Will my current computer be sufficient or do I need a high-performance workstation with more RAM, storage and CPU cores? |
| Am I prepared to share data with collaborators or global databases? | Do I understand the relevant data-sharing policies (e.g. for ENA, GISAID or public health databases)? Is ethical or patient consent required? |
| Do I need a single, centralised WGS centre or several smaller centres? | Would several smaller, decentralised centres improve turnaround time and sample access, or is a central hub more efficient for coordination and cost? |
| Do I have a trained bioinformatician on staff? | If not, can I hire, train or partner with an external bioinformatics provider? Should I consider using cloud-based plug-and-play tools as a short-term solution? Should I send my data to an external provider for analysis? |
| Do I have a well equipped and functioning microbiology laboratory? | If not, can I invest in improving basic microbiology capacity, including proper sample handling, species identification and AST? Can I partner with existing reference labs or central facilities to ensure high-quality isolates are selected for sequencing? |
| How will I select and collect samples for sequencing? | Do I have a clear sampling strategy for routine surveillance, outbreak response or special studies? Are metadata and tracking systems in place? |
| What is more important for me and my work: high throughput and cost-effectiveness, or accuracy and higher-quality data? | If high throughput and cost-effectiveness are more important, short-read sequencing might be more suitable. Small-volume laboratories may find that lower-throughput machines are more useful because they won’t require you to wait to fill a high-volume machine with samples. |
Discussion
You’ve done well to thoughtfully assess your laboratory’s infrastructure and readiness for WGS implementation. If you have difficulty identifying potential gaps or resources, take the time now to consult with colleagues who are expert in these areas. As you move forward, continue to align your infrastructure planning with your specific goals.
Having learned about the practicalities of establishing a WGS facility, in the next section the focus moves onto examining how a laboratory might be integrated into a wider surveillance network.
4 What are the requirements of a national or regional AMR surveillance system?
In the previous section you looked at the requirements for introducing WGS in an individual laboratory. Now you will look at the requirements for conducting AMR surveillance using WGS within a national, state or regional context.
4.1 Existing capacity
Genomic surveillance has many of the same requirements as phenotypic surveillance. Therefore, a key requirement for building a genomic AMR surveillance system is usually the existence of a functioning phenotypic AMR surveillance system. To conduct AMR surveillance you will need a referral system through which samples are collected and sent to a national reference laboratory (NRL) for analysis. The referral sites should collect the needed metadata related to each sample.
What is metadata? Can you think of examples of typical minimal metadata that should be collected for WGS?
Answer
Metadata is data that describes the context of the sample that the WGS data was collected from. This typically includes the location, date and time of sampling, as well as the species, host and sample source, but could also include relevant demographic, clinical and epidemiological information.
In most cases, the NRL should be endorsed by the national authorities for its surveillance role to lend the laboratory legitimacy and remit. The referral system and NRL will need sufficient resources such as capacity, staff and funding to perform their roles within the system. The referral system should be as comprehensive as possible in both demographic and geographic scope. The timeliness of your referral system is also important: the turnaround time from sample collection and sequencing is vital to ensuring that your system can inform public health action.
The NRL should have the required and competent staff to analyse and use the data resulting from WGS. These specialists must work closely together to achieve their collective surveillance goals. At a minimum this staff should include the specialists listed below:
- Bioinformatician: Responsible for ensuring sequencing data quality is suited for analysis. They will also employ tools for sequencing data analysis. They should be able to use a variety of bioinformatic tools for both analysis and quality control. They should ideally have strong knowledge of genomics and how to work with genomic data because they will interpret what the data shows for the other team members.
- Microbiologist: Responsible for interpreting bacterial typing results. Their job is to determine what is important about a specific bacterium within a specific context. The microbiologist will work closely with the bioinformatician to help them determine what markers to look for in the data; they will also work closely with the epidemiologist to provide an interpretation of the biological data for action.
- Epidemiologist: Responsible for examining and interpreting epidemiological data, resistance trends and changing epidemiology. They will identify possible sources of outbreaks, and record and report outbreak signals to determine what action should be taken to protect public health. The epidemiologist will work closely with the bioinformatician to determine what type of analysis should be conducted.
4.2. Pathogen selection and prioritisation
A national or regional plan for priority pathogens for sequencing can also be important for introducing WGS into your AMR surveillance system. Thinking about local disease burden, the population’s immunity, case-fatality rates, outbreak risk, transmissibility and drug resistance will help inform this plan (Khoo et al., 2024). Phenotypic data such as antimicrobial-susceptibility profiles can further guide the selection of isolates for sequencing by highlighting unusual resistance patterns or treatment failures. This ensures that sequencing efforts are targeted toward the most clinically and epidemiologically relevant cases.
4.3 Data for action
The purpose of collecting and analysing the AMR surveillance data is to inform public health actions. Therefore, a major consideration for establishing a WGS system for AMR surveillance is whether there is political commitment to use the data. This commitment should ideally be codified within legislation, policy or regulations. If political commitment and laws exist for the phenotypic surveillance system, they will need to be built upon to also support the use of WGS. Policy-makers and stakeholders should be introduced to the benefits of WGS for AMR surveillance and they should be trained in how to interpret and use the new data.
Ideally, WGS data should be integrated into national AMR or One Health surveillance and reporting systems as soon as possible. This will allow the health system to take advantage of the new data for detecting community or hospital outbreaks. The addition of this new type of data may require upgrades to the current system and staff training in how to upload and use the new data (Rebelo, 2022).
4.4. Regulatory and legal requirements
Many governments have reporting requirements regarding AMR. When certain pathogens are found within the surveillance system, public authorities must be notified. The appearance of other less virulent pathogens might only need to be shared within the country’s reporting system.
Whatever the requirements, the introduction of WGS to a surveillance system should not adversely impact required reporting. Data should be reported in a timely and transparent manner as it was within the phenotypic surveillance system. Regulations concerning data protection and the anonymisation of patient data should also continue to be respected. When data will be shared between entities, data-sharing agreements that outline the terms and conditions for sharing data should be put in place.
Activity 8: Reflections on the requirements for conducting AMR surveillance using WGS in your context
Look at the questions in Table 5 to help you reflect on your system’s readiness for introducing WGS as part of your AMR surveillance. (You may want to use the space below to make notes.)
| Question | Reflection prompts |
|---|---|
| What national, regional or local reporting requirements exist related to AMR surveillance? | Can I meet these requirements with WGS data? If not, what policy changes would need to occur for me to continue to comply with these reporting requirements? Laboratories might have to confirm that using WGS instead of other already established methods complies with national and institutional guidance. |
| Do I have a functioning phenotypic antimicrobial susceptibility testing (AST) AMR surveillance system in my country, state or region? | In most contexts, it makes sense to establish a functioning phenotypic system before moving to WGS. A robust phenotypic AST system provides the foundational data needed to interpret and validate genomic findings. It also ensures that basic infrastructure, laboratory capacity and data management systems are in place – critical prerequisites for successfully integrating WGS into surveillance. |
| Are there authorities and agencies in the country who can act on the data produced from my WGS AMR surveillance system? | If not, how will the collected data be used? For WGS data to have a public health impact, there must be clear pathways for translating genomic findings into policy and action. This requires coordination with stakeholders – such as public health authorities, regulatory bodies and clinical networks – who understand and trust the data and have the mandate to respond. |
Discussion
You’ve taken an important step by evaluating how WGS could fit into your existing AMR surveillance framework. As you continue, consider which colleagues and stakeholders can help you to build partnerships with the relevant authorities and advocate for policy alignment to support the integration of WGS data into your surveillance efforts.
Now that you have considered the wider aspects of whether and how a new WGS facility would fit within your system, the focus shifts to considering the important aspect of the costs involved in establishing a WGS facility.
5 The costs associated with using WGS in an AMR surveillance system
In this section you will cover the costs of introducing and maintaining WGS as part of your AMR surveillance system. You can refer to the course The health and economic burden of AMR for more information on this topic, and the WHO has introduced a genomics costing tool that can serve as a reference for you (WHO, 2024).
While only a few manufacturers dominate the supply of WGS equipment and supplies, costs are variable depending on geography. It is often more expensive to introduce and maintain a WGS system in a low- or middle-income country (LMIC) than in a high-income country owing to the lack of local manufacturing facilities, economies of scale and the cost of transporting materials and equipment – especially items that require a cold chain. Service charges added by local suppliers, national taxes and customs fees can also vary dramatically between countries.

Because of the high costs of conducting WGS, countries might instead consider using regional rather than national or local sequencing laboratories. The WHO report GLASS Whole-genome Sequencing for Surveillance of Antimicrobial Resistance (2020) recommends the creation of regional ‘hub-and-spoke’ surveillance systems where participating countries can send isolates of interest to a regional sequencing centre.
As you think about the costs of WGS, Table 6 can help you to compare the average costs and scale of your current phenotypic surveillance system with a WGS system.
| Cost category | Phenotypic ID and AST | WGS |
|---|---|---|
| Initial equipment cost | Low | High (e.g. $100,000–$700,000) |
| Reagent cost per isolate | Low | Moderate to high (e.g. $50–$140) |
| Staff training needs | Basic microbiology skills | Advanced genomics and bioinformatics |
| Infrastructure needs | Basic laboratory set-up | Sequencer, cold chain, computing power |
| Data analysis complexity | Low | High |
| Data richness | Limited to resistance phenotype | High-resolution genotypic data |
5.1 Set-up costs
The costs of setting up WGS in a laboratory will depend on many factors, including the considerations below.
- What infrastructure is currently in the laboratory? Laboratories that already conduct molecular methods, for example, will see lower conversion costs to WGS.
- How many isolates will be sequenced on a regular basis? This will determine whether you need a large, high-throughput machine or can use a smaller one.
- Is the laboratory currently limited to phenotypic methods such as AST? Laboratories without existing molecular workflows may face steeper initial investments in equipment, staff training and bioinformatics capacity. However, leveraging existing AST data to prioritise isolates for sequencing can help to maximise the value of early WGS efforts and support a phased implementation approach.
As you think about the costs of setting up a system, don’t forget about broadband internet connections, generators and uninterruptible power supplies.
For laboratories currently using only phenotypic AST, it is important to recognise that these methods will continue to play a role in AMR surveillance; WGS is a complementary tool that enhances the resolution and scope of surveillance, rather than a replacement for existing phenotypic systems.
5.2 Staffing and training
As described above, a WGS system requires at minimum laboratory scientists with genomics experience, bioinformaticians with epidemiology and microbiology training, and an epidemiologist. Ongoing skills development should be considered as part of your budget owing to the continually evolving nature of genomics technologies, protocols and bioinformatic approaches.
The cost of hiring staff and training them in new skills will vary depending on the local job market – but note that specialists skilled in these areas can be difficult to hire and retain in LMICs (Halpin, 2025).
5.3 Ongoing costs
Anyone contemplating the introduction of WGS to their AMR surveillance must also consider the maintenance and running costs of the system.
Procuring the necessary reagents can be costly and challenging for many LMICs’ laboratories because of a poor supply chain. Many reagents for WGS have a short shelf-life and/or must be kept cold, so delays owing to customs clearance can be expensive and wasteful. Establishing a network for procurement with other laboratories in your area/country is one solution to be considered prior to starting up WGS. Similarly, establishing a national procurement forecasting plan for reagents can also be a helpful tool (Khoo et al., 2024).
The price of reagents varies according to geography and suppliers. The Fleming Fund SeqAfrica project, for example, saw the price of sequencing a single isolate range from £50 to £140 depending on the country and the throughput of the laboratory. It is worth considering, however, that the cost of testing for all known AMR mechanisms at once using WGS is only marginally higher than testing for only one mechanism, whereas testing all the necessary antimicrobials with phenotypic AST would require more reagents, materials and staff time.
By contrast, phenotypic AST has relatively low and predictable ongoing costs. Reagents such as antibiotic disks or broth media are widely available, have longer shelf lives and do not require cold-chain logistics. Additionally, AST does not require highly specialised staff or computational infrastructure, making it more sustainable for routine surveillance in many low-resource settings. However, while WGS has higher per-sample costs, it can provide broader data from a single test, potentially reducing the need for multiple phenotypic assays.
Beyond ongoing procurement, you should consider the cost of repairs and maintenance of expensive WGS machines. Most suppliers of WGS machines offer a service contract for the first year after the machine is purchased; however, after this runs out, further coverage can be very expensive. For example, in 2024 one laboratory in Senegal was offered a service contract costing $8000 for a one-year contract on a NextSeq 550, while a laboratory in Ghana was quoted $25,000 for a one-year contract on a NextSeq 2000 system. These costs may strain laboratory budgets, but a single repair can cost as much as the service contract, if not more, making the contract a good investment and insurance mechanism.
5.4 Should I consider outsourcing?
If you are beginning to contemplate the utility of WGS for your AMR surveillance system, you might consider outsourcing some or all the tasks associated with the WGS process. Commercial sequencing services can conduct tasks ranging from sample preparation to sequencing to basic or complex bioinformatic analysis. There are also services and genomic platforms focused on bioinformatic analysis that may be of interest to new entrants to WGS.
By outsourcing your WGS needs at first, you will be able to demonstrate to key policy-makers and other stakeholders the value of WGS for your surveillance. Commercial providers will also have fast turnaround time for analysis, provide high-quality results, and can scale up or down based on your current workload.
However, outsourcing comes with its own challenges. For example:
- shipping biological materials can be tricky and expensive
- material transfer agreements must be negotiated between the laboratory providing the sample and the sequencing or analytical company
- governments may not allow or may discourage samples leaving their national borders.
All these considerations must be taken into account when considering outsourcing WGS services.
Having now considered the costs of WGS, the course finishes with a look at the economic advantages of introducing this technology.
6 The economic advantages of WGS for AMR surveillance
What are some of the ways that using WGS as part of an AMR surveillance system can provide economic benefits to a country or region?
While the above-mentioned costs associated with WGS can seem overwhelming, the economic benefits of introducing the new technology are also remarkable. The introduction of a tool that can aid in early detection and identification of outbreaks in the short term and can prevent the longer-term loss of economic growth and productivity can be highly beneficial.
The use of WGS can:
- guide antimicrobial stewardship
- evaluate the effectiveness of diagnostic tools
- improve contract tracing (Khoo et al., 2024).
Because AMR impacts not just humans but animals and food as well, cost ‘gains’ associated with averted outbreaks can save significant sums by preventing the need to cull herds or stop the export of a country’s produce.
While it is difficult to put a specific value on the gains of an outbreak that was avoided or mitigated, a major economic benefit of surveillance is preparedness – which should not be underestimated.
A few studies have tried to monetise these savings. An analysis of the USFDA GenomeTrakr SGS Network estimated that the system would accrue an estimated annual health benefit of nearly $500 million, compared with an approximately $22 million investment by public health agencies (Brown et al., 2021). A study of the introduction of WGS in the detection of Salmonellosis outbreaks in Canada estimated monetary and non-monetary costs. The incidence of illnesses in Canada was 47,082 annually, representing a cost of C$287.78 million (total cases) and C$166.28 million (reported cases). The introduction of WGS was estimated to accrue benefits ranging from C$5.21 million to C$90.25 million (Jain, Mukhopadhyay and Thomassin, 2019).
7 Using WGS for AMR in your work
You should now have a better understanding of how WGS can be used for AMR surveillance. Before you finish this course, the final activity below will help you to think about your role in introducing the concept of WGS to your peers and stakeholders.
As you consider integrating WGS into your AMR surveillance activities, remember that phenotypic testing remains important for monitoring resistance trends, validating genomic predictions and fulfilling reporting obligations. WGS adds depth and context to the data from these, enabling a more comprehensive understanding of resistance dynamics.
Moving forward, you might want to consult these resources for further learning:
- Online courses and webinars created through the SeqAfrica project (DTU National Food Institute, n.d. 2)
- GLASS Whole-genome Sequencing for Surveillance of Antimicrobial Resistance (WHO, 2020)
- Global Genomic Surveillance Strategy for Pathogens with Pandemic and Epidemic Potential, 2022–2032 (WHO, 2022)
- Whole Genome Sequencing as a Tool to Strengthen Foodborne Disease Surveillance and Response (WHO, 2023)
- Whole Genome Sequencing for Foodborne Disease Surveillance: Landscape Paper (WHO, 2018)
Activity 9: WGS for AMR surveillance in your work
Think about WGS and its use in AMR surveillance. Then reflect and make notes in response to the following question:
- Based on your work in Activities 4 and 5, do you think you are ready to take the next steps towards introducing WGS into your AMR surveillance system? If so, what would your next steps be?
- Would WGS positively influence your current AMR surveillance work? If so, in what ways?
- How might you make a case for the introduction of WGS in your work?
- Are there any legal or regulatory considerations that should be taken into account when thinking about introducing WGS for AMR surveillance in your context?
- If your laboratory or system currently lacks the infrastructure needed to introduce WGS, are there other ways that you might begin to build up the equipment, supplies, skills, tools and support for using WGS for surveillance?
- Have you thought about outsourcing WGS services? If so, why would this help you address your AMR surveillance needs?
Discussion
Hopefully your reflections here have helped you further consider both the potential benefits and practical considerations involved in introducing WGS into AMR surveillance. Keep refining your case for WGS by aligning it with national priorities and showing how it can enhance the impact of your current surveillance efforts.
8 End-of-course quiz
Well done – you have reached the end of this course and can now do the quiz to test your learning.
This quiz is an opportunity for you to reflect on what you have learned rather than a test, and you can revisit it as many times as you like.
Open the quiz in a new tab or window by holding down ‘Ctrl’ (or ‘Cmd’ on a Mac) when you click on the link.
9 Summary
In this course you have learned the basics of introducing WGS into your AMR surveillance system. You have read about the WGS process in the laboratory, the minimum requirements for introducing WGS into an AMR surveillance system and the costs and cost benefits associated with using WGS.
You should now be able to:
- describe the basic principles of WGS
- explain when, how and why WGS is used in AMR surveillance, and how it complements other types of testing and data to strengthen the AMR surveillance system
- give examples of how WGS is used in AMR-related surveillance
- reflect on how increasing WGS capacity could strengthen AMR surveillance in your work
- recognise the cost and economic advantages of WGS for AMR surveillance and understand the barriers to its implementation
- outline what is needed to make the case for increasing WGS capacity in your work.
Now that you have completed this course, consider the following questions:
- What is the single most important lesson that you have taken away from this course?
- How relevant is it to your work?
- Can you suggest ways in which this new knowledge can benefit your practice?
When you have reflected on these, go to your reflective blog and note down your thoughts.
Activity 10: Reflecting on your progress
Do you remember at the beginning of this course you were asked to take a moment to think about these learning outcomes and how confident you felt about your knowledge and skills in these areas?
Now that you have completed this course, take some time to reflect on your progress and use the interactive tool to rate your confidence in these areas using the following scale:
- 5 Very confident
- 4 Confident
- 3 Neither confident nor not confident
- 2 Not very confident
- 1 Not at all confident
Try to use the full range of ratings shown above to rate yourself:
When you have reflected on your answers and your progress on this course, go to your reflective blog and note down your thoughts.
10 Your experience of this course
You’ve now reached the end of this course. If you’ve enrolled on a pathway, please go back to the pathway page and tick the box to confirm that you’ve completed this course. On the pathway page you’ll see both your progress so far as well as the other courses you need to complete in order to achieve your Certificate of Completion for that pathway.
Now that you have completed this course, take a few moments to reflect on your experience of working through it. Please complete a survey to tell us about your reflections. Your responses will allow us to gauge how useful you have found this course and how effectively you have engaged with the content. We will also use your feedback on this pathway to better inform the design of future online experiences for our learners.
Many thanks for your help.
References
Aworh, M.K., Ekeng. E., Nilsson, P., Egyir, B., Owusu-Nyantakyi, C., and Hendriksen, R.S. (2022) ‘Extended-spectrum ß-lactamase- producing Escherichia coli among humans, beef cattle, and abattoir environments in Nigeria’, Frontiers in Cellular and Infection Microbiology, 12 (869314) [online]. Available at doi: 10.3389/fcimb.2022.869314 (accessed 11 June 2025).
Brown B., Allard M., Bazaco M.C., Blankenship J., Minor T. (2021) ‘An economic evaluation of the Whole Genome Sequencing source tracking program in the U.S.’, PLoS ONE, 16(10): e0258262 [online]. Available at: https://doi.org/10.1371/journal.pone.0258262 (Accessed: 11 June 2025).
Centers for Disease Control and Prevention (CDC) (2023) ‘What is genomic sequencing?’ [online]. Available at https://www.cdc.gov/advanced-molecular-detection/about/what-is-genomic-sequencing.html (accessed 11 June 2025).
The Comprehensive Antibiotic Resistance Database (CARD), https://card.mcmaster.ca/ (accessed 8 August 2025).
The Danish Integrated Antimicrobial Resistance Monitoring and Research Programme (DANMAP), https://www.danmap.org/ (accessed 7 August 2025).
The Danish Integrated Antimicrobial Resistance Monitoring and Research Programme (DANMAP) (n.d.) ‘Danmap explorer’ [online]. Available at https://www.danmap.org/dashboard (accessed 7 August 2025).
DNA Data Bank of Japan (DDBJ), https://www.ddbj.nig.ac.jp/index-e.html (accessed 8 August 2025).
DTU Center for Genomic Epidemiology (2024) ‘ResFinder’, version 4.7.2, 22 March [online]. Available at https://genepi.dk/resfinder (accessed 8 August 2025).
DTU National Food Institute (n.d. 1) ‘Fleming Fund regional grant SeqAfrica’ [online]. Available at https://www.food.dtu.dk/english/topics/antimicrobial-resistance/seqafrica (accessed 7 August 2025).
DTU National Food Institute (n.d. 2) ‘SeqAfrica resources’ [online]. Available at https://www.food.dtu.dk/english/topics/antimicrobial-resistance/seqafrica/seqafrica-resources (accessed 8 August 2025).
European Nucleotide Archive (ENA), https://ena-browser-docs.readthedocs.io/en/latest/ (accessed 8 August 2025).
Illumina [YouTube user] (2016) ‘Overview of Illumina sequencing by synthesis workflow | standard SBS chemistry’, YouTube, 5 October [online]. Available at https://www.youtube.com/watch?v=fCd6B5HRaZ8 (accessed 7 August 2025).
Jain, S., Mukhopadhyay, K. and Thomassin, P.J. (2019) ‘An economic analysis of salmonella detection in fresh produce, poultry, and eggs using whole genome sequencing technology in Canada’, Food Research International, 116, pp. 802–9 [online]. Available at https://doi.org/10.1016/j.foodres.2018.09.014 (accessed 11 June 2025).
Khoo, Y.K., Wulandari, S., Getchell, M., Moe, L., Kumar, S.S., Liu, E.J., Sun, Y., Pang, J., Mishra, S., Clapham, H., Marais, B., Sintchenko, V., de Alwis, R., Hipgrave, D., and Pronyk, P.M. (2025) ‘National investment case development for pathogen genomics’, Cell Genomics, 5(3), 100781 [online]. Available at https://doi.org/10.1016/j.xgen.2025.100781 (accessed 11 June 2025).
Lacy-Roberts, N. (2025) ‘Figure 1: Genetic components of a bacterial cell’, created in BioRender [online]. Available at https://biorender.com/h1tar74 (accessed 11 August 2025).
Laufer Halpin, A., Mathers, A.J., Walsh, T.R., Zingg, W., Okeke, I.N., McDonald, L.C., Elkins, C.A., Harbarth, S., Peacock, S.J., Srinivasan, A., Bell, M., Pittet, D., Cardo, D. and 3rd Geneva Infection Prevention and Control Think Tank (2025) ‘A framework towards implementation of sequencing for antimicrobial-resistant and other health-care-associated pathogens’ The Lancet: Infectious Diseases, 25(4), e235–e244 [online]. Available at https://doi.org/10.1016/S1473-3099(24)00729-1 (accessed 11 June 2025).
National Center for Biotechnology Information (NCBI) (n.d.) ‘GenBank’, National Library of Medicine [online]. Available at https://www.ncbi.nlm.nih.gov/genbank/ (accessed 8 August 2025).
Nilsson, P. (2025) ‘Figure 3: The four stages of WGS for AMR surveillance’, created in BioRender [online]. Available at https://biorender.com/lqzgrel (accessed 11 August 2025).
Oxford Nanopore Technologies (n.d.) ‘How nanopore sequencing works’ [online]. Available at https://nanoporetech.com/platform/technology (accessed 7 August 2025).
Rebelo, A.R. (2022) ‘Infectious diseases and whole-genome sequencing: the “One day in Denmark” project’, DTU National Food Institute [online]. Available athttps://orbit.dtu.dk/en/publications/infectious-diseases-and-whole-genome-sequencing-the-one-day-in-de (accessed 11 June 2025).
Rebelo, A.R., Bortolaia, V., Leekitcharoenphon, P., Hansen, D.S., Nielsen, H.L., Ellermann-Eriksen, S., Kemp, M., Røder, B.L., Frimodt-Møller, N., Søndergaard, T.S., Coia, J.E., Østergaard, C., Westh, H. and Aarestrup, F.M. (2025) ‘One day in Denmark: whole-genome sequence-based analysis of Escherichia coli isolates from clinical settings’, Journal of Antimicrobial Chemotherapy, 80(4), pp. 1011–21 [online]. Available at https://doi.org/10.1093/jac/dkaf028 (accessed 12 June 2025).
SeqAfrica (n.d.) ‘How to decide what to sequence’, webinar [online]. Available at https://panopto.dtu.dk/Panopto/Pages/Viewer.aspx?id=30570585-4397-40af-a7b6-b22000fc42ed (accessed 7 August 2025).
Torres, L.M., Johnson, J., Valentine, A., Brezak, A., Schneider, E.C., D’Angeli, M., Morgan, J., Brostrom-Smith, C., Hua, C. N., Tran, M., Lucas, D., De Leon, J.G., MacKellar, D., Dykema, P., Kauber, K.J. and Black, A. (2025) ‘Integrating genomic data into public health surveillance for multidrug-resistant organisms, Washington, USA’, Emerging Infectious Diseases, 31(13), pp. 25–34 [online]. Available at https://doi.org/10.3201/eid3113.241227 (accessed 11 June 2025).
The Virulence Factor Database, https://www.mgc.ac.cn/VFs/ (accessed 8 August 2025).
World Health Organization (WHO) (2018) Whole Genome Sequencing for Foodborne Disease Surveillance: Landscape Paper, 29 April. Geneva: WHO [online]. Available at https://www.who.int/news/item/07-11-2023-who-launches-guide-on-whole-genome-sequencing-use-as-a-tool-for-foodborne-disease-surveillance-and-response (accessed 8 August 2025).
World Health Organization (WHO) (2020) GLASS Whole-genome Sequencing for Surveillance of Antimicrobial Resistance. Geneva: WHO [online]. Available at https://www.who.int/publications/i/item/9789240011007 (accessed 11 June 2025).
World Health Organization (WHO) (2022) Global Genomic Surveillance Strategy for Pathogens with Pandemic and Epidemic Potential, 2022–2032, 28 March. Geneva: WHO [online]. Available at https://www.who.int/publications/i/item/9789240046979 (accessed 5 September 2025).
World Health Organization (WHO) (2023) ‘WHO launches guide on whole genome sequencing use as a tool for foodborne disease surveillance and response’, 7 November [online]. Available at https://www.who.int/news/item/07-11-2023-who-launches-guide-on-whole-genome-sequencing-use-as-a-tool-for-foodborne-disease-surveillance-and-response (accessed 8 August 2025).
World Health Organization (WHO) (2024) Genomics Costing Tool: User Manual, technical document, 26 March. Geneva: WHO [online]. Available at https://www.who.int/publications/i/item/9789240090866 (accessed 8 August 2025).
Acknowledgements
This free course was collaboratively written by Rene Hendriksen, Christa Twyford Gibson, Colette June Weese, Niamh Lacy Roberts and Mark Hirst, and reviewed by Ben Amos, Corrado Minetti, Emmanuel Azore and Rachel McMullan.
Except for third party materials and otherwise stated (see terms and conditions), this content is made available under a Creative Commons Attribution-NonCommercial-ShareAlike 4.0 Licence.
The material acknowledged below is Proprietary and used under licence (not subject to Creative Commons Licence). Grateful acknowledgement is made to the following sources for permission to reproduce material in this free course:
Images
Course banner: PASIEKA/SCIENCE PHOTO LIBRARY/Universal Images Group
Figure 1: Lacy-Roberts (2025); created in BioRender, https://BioRender.com/h1tar74; this file is licensed under the Creative Commons Attribution Licence https://creativecommons.org/licenses/by/4.0/
Figure 2: DANMAP
Figure 3: Aworh et al. (2022) ; this file is licensed under the Creative Commons Attribution Licence https://creativecommons.org/licenses/by/4.0/
Figure 4: adapted from https://www.who.int/publications/i/item/9789240011007
Figure 5: Nilsson (2025); created in BioRender, https://BioRender.com/lqzgrel; this file is licensed under the Creative Commons Attribution Licence https://creativecommons.org/licenses/by/4.0/
Figure 6: DTU Food, GloCab
Figure 8: captured by Niamh Lacy-Roberts
Figure 10: panumas nikhomkhai/Pexels
Figure 11: Martin Lopez/Pexels