
2.2 How can WGS surveillance supplement phenotypic surveillance?
Phenotypic surveillance is widely used to monitor AMR but often has practical limitations, especially in low-resource settings. Time, cost and infrastructure constraints mean that routine surveillance is often limited to identifying the species,
In most routine surveillance systems, particularly in hospital and veterinary contexts, phenotypic AST continues to serve as the primary method for detecting resistance trends. The data forms the foundation of national and international AMR reporting systems, and is indispensable for tracking resistance prevalence over time.
While WGS offers powerful capabilities, it is not a replacement for phenotypic testing. WGS provides predictions of resistance based on known genes and mutations, but it cannot confirm whether those genetic determinants are expressed or functional. In this sense, WGS is best viewed as a complement to phenotypic surveillance. Phenotypic AST continues to play a critical role in validating genotypic predictions, revealing discrepancies and capturing resistance mechanisms that may not yet be well characterised in genetic databases. That said, phenotypic AST is not without its own limitations: it can miss low-level resistance and may be affected by test conditions.
As sequencing technologies advance, a genomic era is being entered where WGS is increasingly taking the lead in AMR surveillance. It offers the ability to detect a broad range of resistance genes, uncover transmission dynamics and generate detailed data from a single assay. While WGS is not yet ready to replace phenotypic testing for decisions about clinical treatment, it is already transforming how AMR is detected, understood and monitored. In the future, phenotypic testing may take on a more selective role, serving primarily as a confirmatory tool to support increasingly comprehensive genomic approaches.
Here’s how WGS adds value.
- Addressing limitations of routine testing: As described above, WGS provides more detailed information than standard tests, making it easier to spot new threats and understand how resistance spreads – saving time and enabling consistent, scalable surveillance across settings.
- Improving the accuracy of resistance detection: A
concordance study has shown that WGS can be more accurate than phenotypic AST – especially where testing quality is inconsistent or performance varies (Rebelo et al., 2025). - Detecting clinically relevant resistant genes: One of the biggest concerns in AMR surveillance is that most resistance genes affect how bacteria respond to treatment; by detecting these genes, WGS can indicate real clinical risk, making it a powerful tool for early warning systems and timely public health action.
- Explaining unusual phenotypic results: WGS can reveal mutations or resistance mechanisms that explain unexpected AST results, such as resistance without an obvious gene or vice versa.
- Enabling tracking and prediction: WGS can spot signs of antibiotic resistance before they show up in standard laboratory tests, helping track how resistance spreads between people, animals and the environment, and catching new threats early.
Having seen a summary of how WGS adds value to surveillance systems, Case Study 2 highlights some of the real-life benefits.
Case Study 2: ESBL-producing E. coli in Nigerian abattoirs: the added value of WGS
By combining tests for phenotypic antimicrobial susceptibility with WGS, Aworh and colleagues achieved a more holistic understanding of AMR dynamics at the human-animal-environment interphase. Their research, which was conducted in two major Nigeria abattoirs, investigated the prevalence and genetic characteristics of extended-spectrum ß-lactamase-producing Escherichia coli (ESBL-EC) in humans, cattle and environmental samples (Aworh et al., 2022). One example of their data is shown in Figure 3.
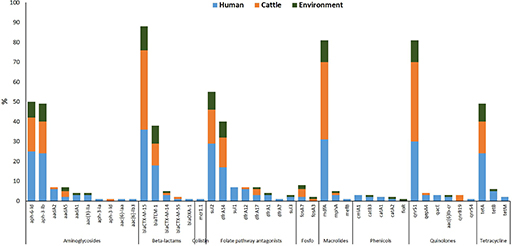
What does Figure 3 tell you about how resistance genes such as blaCTX-M-15 or sul1 are distributed across humans, cattle and the environment?
(Sul1 is a sulphonamide resistance gene; blaCTX-M-15 is an extended-spectrum β-lactamase [ESBL] resistance gene.)
Answer
Figure 3 shows that some resistance genes, like blaCTX-M-15 and sul1, are found in E. coli isolates from all three sources: humans, cattle and the environment.
What kind of insight does WGS provide in this example that would not be visible from phenotypic testing alone?
Answer
This suggests that these genes may be circulating between sectors, pointing to possible transmission routes or shared reservoirs of resistance.
WGS allows researchers to detect the exact genes responsible for resistance, something that phenotypic testing alone cannot do. While phenotypic testing can show resistance to a drug class, it cannot reveal whether the same gene is present in different sources or how widespread it is. This genetic detail helps build a clearer picture of how resistance spreads and supports targeted public health interventions.
Phenotypic testing of samples revealed high levels of multidrug resistance, while WGS provided deeper insights into the genetic mechanisms underpinning resistance. WGS identified the widespread presence of key resistance genes, clonal relationships and gene transfer among isolates. The study also highlighted abattoir workers as a high-risk group for faecal carriage of ESBL-EC.
These findings underscore the importance of a One Health approach and demonstrate how genomic tools can enhance surveillance, inform risk assessment and support evidence-based policy decisions such as regulating antimicrobial use in livestock and improving hygiene practices in abattoirs.
What was one key benefit of using WGS as described in Case Study 2?
Answer
WGS added value by revealing the genetic mechanisms behind antibiotic resistance in E. coli found in humans, cattle and the environment. It identified key resistance genes, showed how the bacteria were related, and provided evidence of gene transfer between bacteria – insights that phenotypic testing alone could not provide. This helped highlight abattoir workers as a high-risk group and supported the need for better hygiene and antimicrobial use policies.
2.1 What are the main uses of WGS data for surveillance?