
3.4 Data analysis
After the sequencing is completed, the machine returns DNA fragment sequences (‘reads’) that can be analysed on a computer.
Can you recall the two types of sequencing machines in common use, based on
Answer
How do the sequences generated by these two systems compare with regard to quality?
Answer
Short-read sequences are more accurate, but the less accurate long-reads are better for resolving complex regions of the genome.
Before further analysis, a quality control (QC) step ensures that only
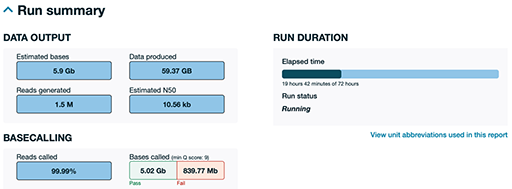
The sample portion of a QC report generated by ONT during a sequencing run shown in Figure 8 was generated about 19 hours into a 72-hour run. This is just a portion of a much larger report to give you a sense of how an ONT run report looks. As can be seen, the system has produced approximately 60 gigabytes (GB) of raw data. You can see that 99.99% of the sequence has been successfully read as base pairs (reads called), with only a tiny percentage being highlighted as a fail. This is only a partial run; ONT runs typically generate even more data if allowed to complete the full 72 hours. ONT provides detailed, real-time QC to help users monitor yield, quality and run progress at any time.
Once the high-quality data is ready, it is analysed using specialised software. This can be done by trained bioinformaticians, but there are also free, cloud-based platforms available that make analysis more accessible, especially for smaller labs or public health institutions.
The next steps depend on the type of sequencing that has been performed, as detailed below.
- With short-read data, the DNA fragments are usually compared to the sequence of a known
reference genome . This helps to identify DNA sequence differences between your sample and known strains, such as changes that may affect resistance to antibiotics, how the bacteria are spreading or how they may have evolved. - With long-read data, the software often builds the sequence of the genome from scratch – a process called
genome assembly . This approach is especially good for detecting plasmids,mobile resistance genes and parts of the genome that are difficult to analyse using short-read technologies. Plasmids and mobile resistance genes are important because they often carry AMR genes and can move between bacteria. This means they can spread resistance not just within one species but across different species and environments. Being able to detect and track these elements helps us understand how resistance is spreading and where interventions may be needed.
After the reads are mapped or assembled into a full genome, the sequences can be uploaded by the users to a trusted international database such as ResFinder [Tip: hold Ctrl and click a link to open it in a new tab. (Hide tip)] , CARD (The Comprehensive Antibiotic Resistance Database), and VFDB (The Virulence Factor Database), where the reads are compared to existing genomes already in the database to see how closely related they are. This is important for tracking outbreaks, understanding how resistance is spreading, and identifying the likely source of an infection.
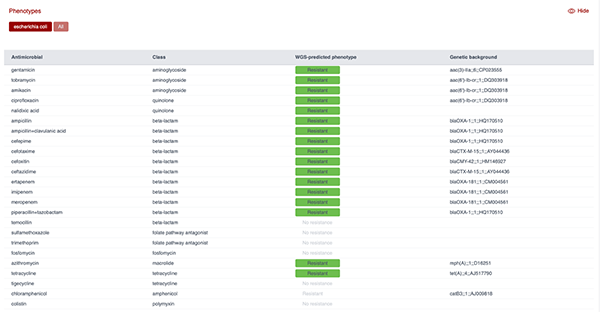
Figure 9 shows the AMR profile predicted from the genome of an E. coli isolate using the ResFinder tool. As can be seen, the panel lists antimicrobials screened, their class, the predicted resistance phenotype based on WGS and the genetic background (i.e. the resistance gene detected). This output demonstrates how WGS can be used to predict resistance to multiple antibiotic classes and link phenotypes to specific genetic determinants.
While this course focuses on sequencing from cultured isolates, another emerging approach is
Activity 6: The four stages of WGS
Drag and drop the four stages of WGS described above into the correct order.
Two lists follow, match one item from the first with one item from the second. Each item can only be matched once. There are 4 items in each list.
Sample collection
DNA isolation and library preparation
Sequencing
Data analysis
Match each of the previous list items with an item from the following list:
a.2
b.3
c.4
d.1
- 1 = d,
- 2 = a,
- 3 = b,
- 4 = c
3.3 Sequencing