

5 Comparing surveillance data between sectors
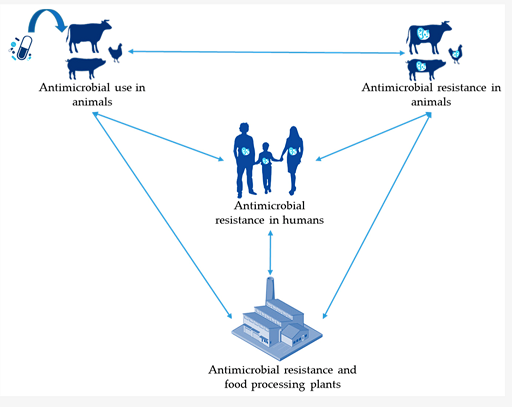
Antimicrobial resistance is a health issue with cross-sector repercussions. It affects the human, animal and agricultural health sectors. Antimicrobials are widely used across all these different sectors to treat infections and prevent diseases (human, animal and agricultural sectors) and to promote growth (animal and agricultural sectors). The use of antimicrobials in one sector has an impact on that sector and on the other sectors. For example, a build-up of antibiotic resistance in the animal sector has an impact on human health by way of animals consumed as food (or food-producing animal products). Consequently, the build-up of antibiotic resistance in humans leads to the contamination of the environment, including water bodies that may serve as drinking water to animals and humans (Figure 5). This inter-sectoral link between the human, animal, agricultural sectors and the environment is critical and is acknowledged by the WHO’s ‘One Health’ approach to AMR. The ‘One Health’ approach aims to drive concerted and collaborative efforts, across these different sectors, to mitigate the threat posed by AMR. You can learn more on why and how a One Health approach can be taken to tackle the issue of AMR in the module Introducing a One Health approach to AMR.
It is, therefore, of critical importance that AMR surveillance data can be compared across these different sectors. This involves being able to initially compare indicators:
- Antimicrobial use in humans
- Antimicrobial use in animals
- Prevalence of AMR in humans
- Prevalence of AMR in animals
From a surveillance system point-of-view, to gather these different types of data is challenging as they relate to very different types of information, which in turn rely on different sampling techniques, laboratory infrastructure and use different definitions. Where these data do all exist in a country, it is often very difficult to compare data from animal to data from human sector.
In Section 4, we discussed the example of the JVARM surveillance system, which collects data on antimicrobial sales in the veterinary sector and AMR data from healthy and diseased animal samples. Since 2012, JVARM has collaborated with the
- Escherichia coli
- Enterococcus faecalis
- Enterococcus faecium
- Pseudomonas aeruginosa
- Klebsiella pneumoniae
- Corynebacterium sp.
- Coagulase-negative staphylococci
- Staphylococcus aureus
- Proteus mirabilis
- Enterococcus sp.
- Streptococcus agalactiae
- Alpha-haemolytic Streptococci
- Enterobacter cloacae
In order to compare AMR data across sectors, the data for Escherichia coli (E.coli) from healthy animal samples collected by JVARM are routinely converted into a format comparable to the AMR data for E.coli from hospital samples. E.coli is a good example of a species of bacteria that commonly causes disease in both animals and humans. This step allows cross-sector comparison of trends in AMR for a key organism of importance in both sectors.
Figure 6 shows one such comparison in trends for a particular type of AMR (third-generation cephalosporin-resistant bacteria), using data from Japan. The analysis looks at the proportion of all samples collected with this type of AMR over a period of time (for example, a year) and compares it across the human and animal sectors. Animals reared for consumption include pigs, beef cattle and broilers (chicken reared for meat). This graph tells an interesting story, so take a few minutes to look at the graph before you read the interpretation below.
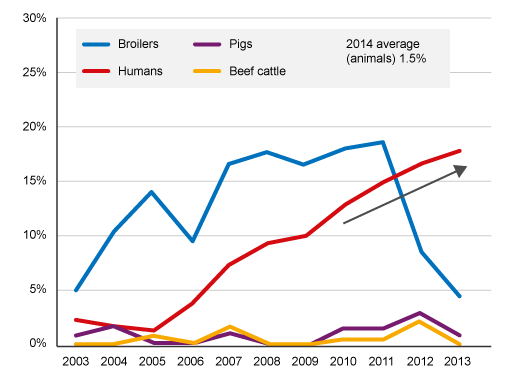
The analysis found a high level of third-generation cephalosporin resistance (>10%) bacteria carried by broiler chickens from 2004 to 2011, reaching around 18% by 2011. The level of this type of resistance in bacteria carried by pigs and beef cattle remained low (
After 2011, there is a notable decrease in this form of AMR in samples taken from broiler chickens. This analysis suggests this decrease was due to the withdrawal of off-label (or generic) antimicrobials from use in the broiler chicken industry in Japan. If you want, you can read more about this analysis [Tip: hold Ctrl and click a link to open it in a new tab. (Hide tip)] . This is an example of the importance of cross-sector surveillance and linked interventions to mitigate the spread of AMR. However, the downward trend in resistance in bacteria isolated from broiler chickens after 2011 is not matched by a similar fall in the human sector, suggesting that other factors were also driving the upward trend in AMR in humans.
4.3 Different types of AMR surveillance
