Step 6 - Recording and Presenting (1)
| What we changed | What we measured |
| temperature (°C) | no. of seeds germinating |
| 10 | 5 |
| 20 | 7 |
| 30 | 9 |
The pupils are encouraged to record the results from their investigation by producing a table of results. The table includes the independent variable (what they were changing) and the dependent variable (what they were measuring). The production of the table of results will help the pupils in constructing a bar chart or graph of their results. An average may need to be taken to get more accurate results. Graphs and charts are powerful tools because they enable pupils to see the result of what they changed (the independent variable) affecting what they measured (the dependent variable). This gives a picture of the information they have collected and helps them to identify patterns and trends. It also helps the pupils to develop understanding by relating pattern and trends to their scientific knowledge. The type of graph that is appropriate depends on the type of variable used for the key variables i.e. what they change (independent variable) and what they measure (dependent variable). The table below shows the types of graphs that should be drawn for different types of variables. |
Step 6 - Recording and Presenting (2)
| What is ... | |||
| ... changed? (independent variable) e.g. | ... measured? (dependent variable) e.g. | Type of table | Type of graph |
WORDS type of cloth | WORDS amount of wear | no graph | |
WORDS type of cloth | NUMBERS size of stain (cm2) | 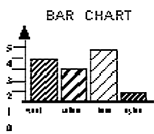 | |
NUMBERS length of pitch of note elastic band (cm) | WORDS pitch of note | no graph | |
NUMBERS concentration of acid (%) | NUMBERS no. of bubbles | 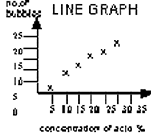 |
Step 6 - Recording and Presenting (3)
| What we measured | |
number of seeds germinating
| |
| temperature (°C) | |
By careful examination of the bar chart or graph, the pupils should be able to identify any trend or pattern that appears in their results. In this case, there is an increase in the number of seeds germinating with increasing temperature. |
Step 5 - Carrying out the experiment