Self-Assessment Questions (SAQs) for Study Session 1
Now that you have completed this study session, you can assess how well you have achieved its Learning Outcomes by answering these questions. Write your answers in your Study Diary and discuss them with your Tutor at the next Study Support Meeting. You can check your answers with the Notes on the Self-Assessment Questions at the end of this Module.
SAQ 1.1 (tests Learning Outcome 1.2)
How does the MMR for Ethiopia in 2005 compare with the MMR for Africa, and the world figure? Justify your choice from the list below.
A It is above the average figure for Africa, and above the average figure for the world.
B It is below the average figure for Africa, and below the average figure for the world.
C It is above the average figure for Africa, and below the average figure for the world.
D It is below the average figure for Africa, and above the average figure for the world.
Answer
D is the correct answer. By 2005, the MMR for Ethiopia was 673 per 100,000 live births — well below the average of 900 per 100,000 live births for Africa as a whole, but still one of the highest in the world. In 2008, the global average MMR was 400 maternal deaths per 100,000 live births.
SAQ 1.2 (tests Learning Outcomes 1.1, 1.3 and 1.5)
Imagine that the total number of people in a catchment area is 10,000, and the total number of first antenatal visits the Health Extension Practitioners (HEPs) made last year was 150.
a.Calculate the number of pregnant women who were eligible for antenatal care services in this catchment area last year.
b.What was the antenatal care coverage rate achieved by the Health Extension Practitioners last year?
Answer
a.The total number of pregnant women in this catchment area is calculated as 4% of the 10,000 population. To calculate 4% of 10,000, you multiply 10,000 by 4 and divide the result by 100. This is as follows:
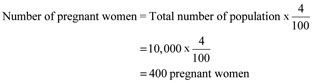
Therefore, this community is expected to have 400 pregnant women in one year, who are eligible for antenatal care, delivery and postnatal care.
b.You calculate the ANC coverage rate as the total number of pregnant women attended at least once during their pregnancy by the Health Extension Practitioners for reasons relating to the pregnancy, divided by the total number of expected pregnancies in the same year. The result is expressed as a percentage by multiplying by 100. You can calculate it as:
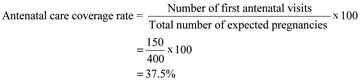
Only 37.5% of the pregnant women in this catchment area received one antenatal visit. These Health Extension Practitioners need to improve the antenatal care coverage rate in their kebele!
SAQ 1.3 (tests Learning Outcome 1.4)
Assume that the total population of a community is 8,000. How many antenatal visits would the Health Extension Practitioners make in one year if they achieved focused antenatal care for every pregnant woman?
Answer
First calculate the expected total number of pregnant women in the 8,000 population in the community, as shown below:
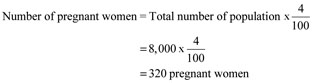
Therefore, this community is expected to have 320 pregnant women in one year, who are eligible for antenatal care, delivery and postnatal care. Then calculate the number of antenatal visits the Health Extension Practitioners would make in one year if they achieved the focused antenatal care coverage rate of 4 visits for every pregnant woman.
320 x 4 = a total of 1,280 antenatal visits.
SAQ 1.4 (tests Learning Outcomes 1.1 and 1.6)
Assume that there were 480 maternal deaths, 960 neonatal deaths and 60,000 live births in Region Y in the year 2005.
- a.Calculate the MMR and the neonatal mortality rate in this region in that year.
- b.Was Region Y doing better or worse than the national average for maternal and neonatal mortalities in Ethiopia in 2005? Justify your conclusions.
Answer
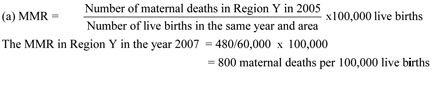

(b) Maternal mortality in Region Y was 800 maternal deaths per 100,000 live births, which is worse than the Ethiopian national average of 673 per 100,000 live births in 2005. It was doing better than the national average for neonatal deaths in 2005 – 16 newborns died in every 1000 live births, compared to 39 per 1000 nationally.
Summary of Study Session 1