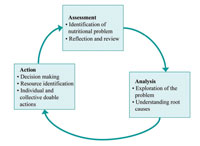
11.5.2 The ‘Triple A’ cycle approach
Growth monitoring can be undertaken using a cyclic process called Triple A cycle. As the term indicates, there are three stages to the process.
Assess
This stage involves weighing a child on a regular basis, and comparing the child’s growth with the standard and with their previous weight. The measurements will determine the rate of the growth of the child. This helps to identify any nutritional problems and will help you reflect on and review the child’s situation with the mother or caregiver.
Analyse
This requires exploration of any nutritional problem of the child in order to understand the root causes of any difficulties. You should identify gaps in feeding or care practices and think about different alternative solutions and resources that you can suggest to the mother or caregiver.
Action
This stage involves counselling the mother or caregiver about relevant actions. It involves decision making and resource identification as well as deciding on individual and collective doable actions. After thorough discussion with the mother or caregiver, you should be able to decide on the specific actions they need to do. Ideally these actions are feasible and can realistically be done by the caregiver and the household. Each time the child is weighed again, re-assessment is done, followed by new analysis and new action as necessary.
Figure 11.2 illustrates the triple A cycle.
The triple A cycle measures the direction of the child’s growth.
The most important issue in growth monitoring is not the position of the child on the growth curve at one particular time, but the direction of his or her growth. Look at Figure 11.3 overleaf. A single point on the line of growth could be reached from different directions (that is, the child’s weight could go down to the single point or could move up to that point on the chart). Normally the child’s measurements are expected to fall between the lines indicated on the graph by -2 and +2 Z-scores (see the right hand side of the graph). The zero (or ‘0’) score represents the standard average measurement.
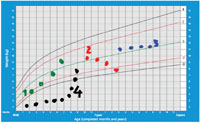
Figure 11.3 plots the direction of growth of four children. It gives you information you need to be able to advise the mother and caregiver what they need to do for their child.
- The child with the green plotted line is growing normally; you should encourage the mother to continue her feeding the way she has been doing it.
- The child with the red plotted line is decreasing weight. There must be something wrong with the feeding. You need to counsel the mother about the optimal feeding practices.
- The child with the blue plotted line is not growing, indicating that there is some problem with its feeding. You need to find out the problem together with the mother or caregiver and counsel them on what to do.
- The child with black plotted line is on catch-up growth (fast growth) after a period of malnutrition. So you should encourage the mother to continue feeding the child in the way she has been doing.
Why are serial (repeated) measurements in growth monitoring needed?
You need to do repeat measurements to check the rate and direction of growth of the child. Knowing the rate and direction of growth will help you when you are counselling the mother or caregiver.
11.5.1 Objectives of growth monitoring