
11 Your task
The key objective of the investigation is to determine the presence/level of organochlorine pesticides (OCPs) in the Chinese coastal bay shown in Figure 8. The bay covers an area of approximately 380 km2 and is fed by a number of rivers running from mainly agricultural land, where the use of OCPs has, in the past, been widespread.
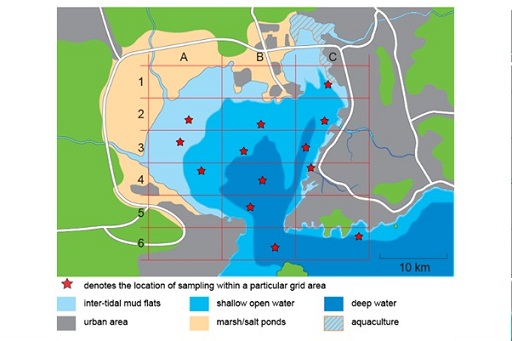
The area surrounding the bay is densely populated; the eastern shore is a largely built up, urban and industrial area with a major port. The bay is tidal with a small opening in the south into the Yellow Sea. The northern shore consists of intertidal flats, which are submerged at high tide but exposed at low tide, salt ponds and a number of ponds used for the cultivation (aquaculture) of shellfish. The bay, like many coastal regions in China, suffers from algal blooms due to high nutrient levels
In order to determine the levels of OCPs in the bay you need to decide which sites to sample. To help you do this most efficiently first think of a hypothesis you would like to test. It is important to compare results with a ‘null hypothesis’. For example, suppose that we want to evaluate pollution from a point source (such as a river or a sewage pipe) into a lake. An example of a null hypothesis would be that there is no change in concentration of a pollutant across the lake, irrespective of its distance from the point source. To test this you might take one sample at the point source and another one or two for comparison at a distance from the point source
- Discuss and form a hypothesis about the concentration of pesticides in the tidal bay area. Use the map and information which follows it, as well as the information given in Table 2 about the particular sampling location for each grid area to help you.
To help you refer to the map and table together it will be useful to copy the table into a Word document. Highlight Table 2 and press Ctrl-C, then open a Word document and press Crtl-V. You may need to adjust the zoom which is in the ‘View’ menu in Word.
- Assume that this is an initial study and you are only able to sample a limited number of sites within the bay. Develop a sampling plan that will test your hypothesis.
Think about:
- Where are the best sites for the sampling?
- How many samples should be taken?
- Write down your hypothesis, null hypothesis and sampling plan.
| Grid reference | Description of location |
| C1 | intertidal flats, close to an area developed for aquaculture |
| A2 | intertidal flats |
| B2 | shallow open water |
| C2 | shallow open water, not far from an estuary of a major river |
| A3 | intertidal flats |
| B3 | shallow open water |
| C3 | deep sea water |
| A4 | shallow open water |
| B4 | deep sea water |
| C4 | shallow open water, in an estuary at the mouth of a major river; is also close to a major port |
| B5 | deep sea water in the inlet into the bay |
| B6 | deep sea water in the inlet into the bay |
| C6 | shallow open water |
Footnotes
Note that no samples were taken in the following sections of the grid: A1, B1, A5, C5 or A6.10 Mass spectroscopy