
14 Calculating concentrations
Now that you have identified the pesticides present at each of your sample locations, your next task will be to complete a quantitative analysis of the samples.
Remember that the concentration of a particular pesticide can be determined from its peak area. This would be done by first comparing with standards of known concentration of that pesticide using a calibration graph.
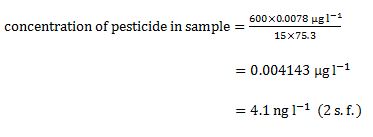
We can use the following equation to calculate the concentration of each pesticide:
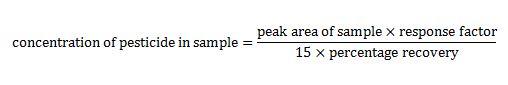
Click on 'reveal answer' if you’d like to know what the ‘response factor’ and ‘percentage recovery’ mean.
Answer
DETAILS OF TERMS USED IN THE EQUATION
The response factor for each pesticide is the ratio of pesticide concentration to peak area. This can be determined from the gradient of a calibration graph that plots peak area against concentration for calibration standards.
The percentage recovery (‘recovery %’) is the percentage of the pesticide compound that can be recovered during the solvent extraction phase. It is determined using a standard where a known mass has been introduced into a sample before the extraction and then measured after the extraction process to see how much of that mass is recovered. Generally, the extraction process is controlled so that a percentage recovery of approximately 90% is achieved.
The water samples taken had a volume of 1500 ml, which were concentrated during the preparation step to 1 ml. This leads to the factor of 15 in the equation.
Table 4 lists the response factors for the range of pesticides analysed, as well as their percentage recovery.
| Pesticide/metabolite | Response factor/μg l-1 | Recovery/% |
| Aldrin | 0.0078 | 75.3 |
| p,p’-DDD Footnotes a | 0.0379 | 93.1 |
| p,p’-DDE Footnotes a | 0.0088 | 90.0 |
| o,p’-DDT Footnotes b | 0.0158 | 79.1 |
| p,p’-DDT | 0.0175 | 88.2 |
| Dieldrin | 0.0123 | 94.4 |
| Endosulfan | 0.0109 | 89.9 |
| Endrin | 0.0152 | 88.9 |
| α-HCH Footnotes c | 0.0064 | 102.1 Footnotes d |
| β–HCH Footnotes c | 0.0159 | 101.6 Footnotes d |
| γ–HCH (lindane) | 0.0078 | 110.7 Footnotes d |
| δ–HCH Footnotes c | 0.0087 | 102.9 Footnotes d |
| Heptachlor | 0.0097 | 72.1 |
| Methoxychlor | 0.0098 | 97.0 |
| PCNB | 0.0089 | 79.5 |
Footnotes
Footnotes a metabolite resulting from the breakdown of p,p’-DDT in the environment. The p, p’ and o is notation given to different isomers.Footnotes
Footnotes b minor isomer present in commercial DDFootnotes
Footnotes c present in commercial HCH (also with γ-HCH)Footnotes
Footnotes d recoveries of greater than 100% can result from uncertainties in determination of the analyte concentrationTry the following example before you analyse your own results:
13 Analysing samples from the bay