
12 Interpreting the data you’ll get
For each of these PCR primer pairs, the PCR reaction is performed by selecting a program in the PCR machine that instructs it to cycle progressively through stages of denaturation (94°C), annealing at a temperature specific for each primer and extension (72°C). As the target DNA is amplified, the numbers of copies increases until it can be detected by the sensors in the machine. At this stage the machine automatically records the fluorescence at each cycle and plots the value on a graph.
On the PCR interface you will be using, this graph appears in the bottom left hand side of the window. In the example shown in Figure 8, you can see the recorded fluorescence for three samples that have undergone analysis for CYP2D6 copy number. You can see that the amount of fluorescence in each sample increases rapidly until the reaction reaches a plateau and no increase is detected (about 30 cycles). At this end stage, the reaction components are used up and amplification stops.
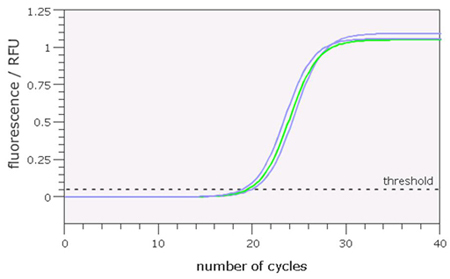
Note that for each sample, the time at which the fluorescent signal starts to increase rapidly is slightly different. The PCR machine detects this point and sets what is called a threshold. The point at which the level of fluorescence passes this threshold is called the Ct value, where C represents the ‘cycle’ number as shown on the horizontal axis. (Note that this value is a calculated value, so not necessarily a whole number).
The examples shown in Figure 8 represent the fluorescence curves detected during a PCR reaction performed on the same quantity of three genomic DNAs from individuals carrying 2, 3 or 4 copies of the CYP2D6 gene.
Of these curves, which is generated from the individual with 4 copies of CYP2D6?
(Hint: Consider the relative number of starting DNA molecules of the CYP2D6 gene and the copies amplified from each.)
Answer
The curve on the left represents the sample with 4 copies of the gene.
Samples with a higher starting number of target DNA sequences will increase more quickly and cross the threshold levels of fluorescence before those with lower copy number. Hence the lower the Ct value, the higher the number of starting molecules. As each reaction contained the same quantity of DNA, we can interpret the difference in Ct values as a difference in gene copy number. In Figure 8, it is possible to distinguish amplification profiles from an individual with 3 copies of the CYP2D6 gene (middle curve, green) from those with 2 or 4 copies (right and left, blue).
You will interpret the data from your PCR experiment in a similar way, in each case determining the CYP2D6 gene copy number and also how many of these copies are the CYP2D6 *4 variant.
11 And now for our genetic tests