
Appendix 2: Teacher’s notes – output of lesson (Spirometry and lung function)
Appendix 2: Teacher’s notes – output of lesson
The spirometer has been designed to produce small differences in output due to natural human variation and instrumental error. The outputs for task 2 and task 3 will differ depending on the parameters selected by your students, however, the changes will be similar to those reported below.
Task 1
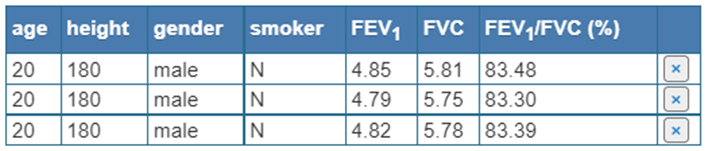
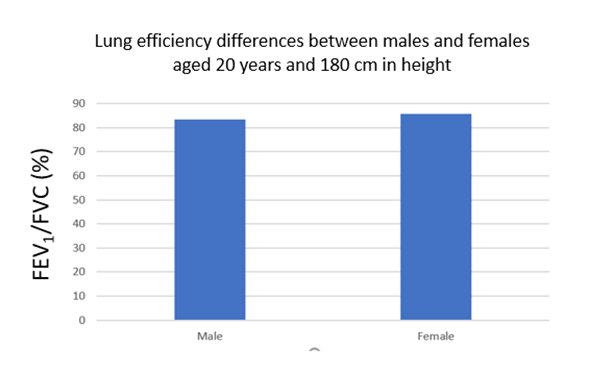
To compare the difference in lung efficiency (FEV1/FVC (%)) between male and females of the same age (20 years) and height (180 cm).
Male data collected using the spirometer:
|
Averages |
4.82 litres |
5.78 litres |
83.39% |
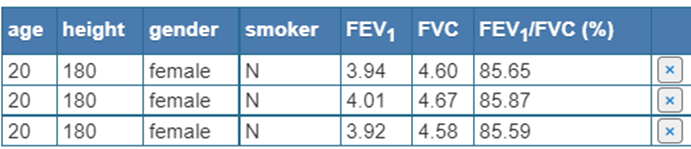
Female data collected using the spirometer:
|
Averages |
3.96 litres |
4.62 litres |
85.70% |
The observations confirm that females have a slighter higher FEV 1/FVC (%) than their male counterparts. However, males have a larger FVC.
Task 2
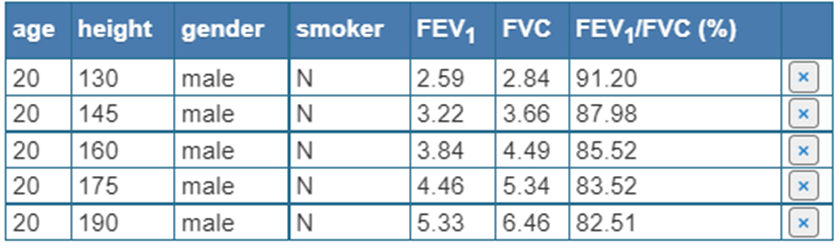
How does increasing height affect lung function?
Below is a data table copied from the spirometer record output for males aged 20 years.
Both FEV1 and FVC show a marked increase in volume with increasing height, however the FEV1/FVC (%) values show a modest decline.
Ask your students to think about this in terms of the deliver of oxygen to the lungs and the removal of the waste gas carbon dioxide. Are taller people really disadvantaged?
Task 3
The effect of tobacco smoking on lung function.
The data set for smokers assumes that they started smoking at the age of 20 and smoked one pack of cigarettes each day throughout their lifetime.
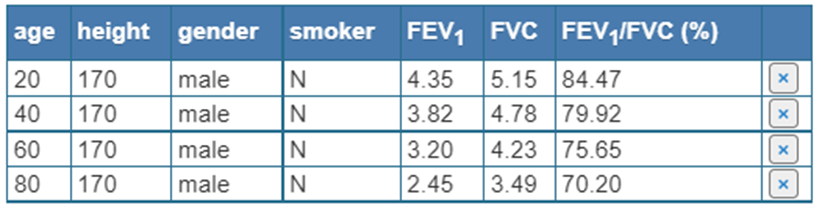
Below is the output from the spirometer for non-smoking males with a height of 170 cm.
Below
is the output from the spirometer for life-long smoking males with a height of
170 cm.
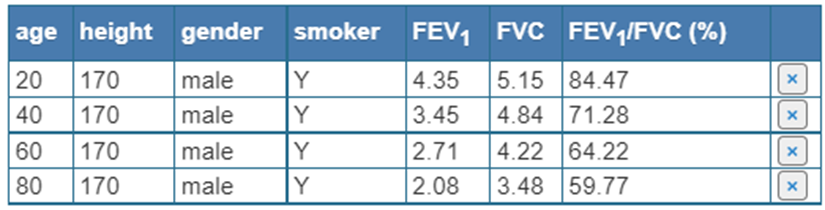
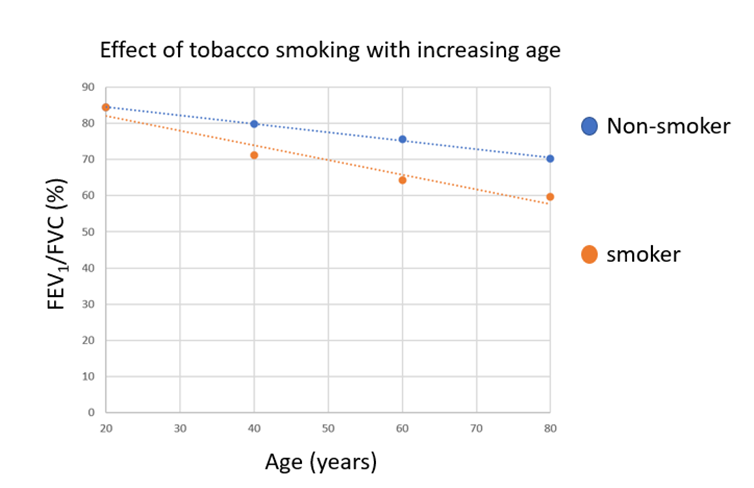
Life-long smoking dramatically reduces lung efficiency. Life-long smokers over the age of 50 are likely to have impaired lung function, FEV1/FVC (%) is less than 70%.
Ask your students how they could improve on the precision of the data set? For example, the fitted trend line suggests that the 70% threshold is breached at the age of 50 in the smoking population – perhaps collecting data with an age interval of 5 and/or 10 years may have been a better approach than the 20-year interval used here?
Previous: Appendix 1 Next: Lesson: Spirometry and lung function