
Appendix 2: Teacher notes - outputs of the lesson (Simple harmonic motion)
Appendix 2: Teacher notes - outputs of the lesson
Task 1
Students were tasked with exploring the relationship between mass, the amplitude used to displace a weighted spring with the period of oscillation using the ‘Simple harmonic oscillation’ experiment accessed via the Spring mass system homepage.
Below is a table of observations collected using the stiff spring.
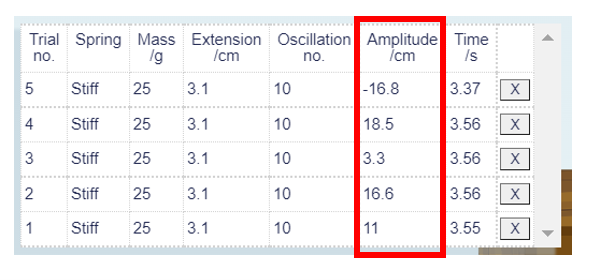
Table 1 Data collected using the stiff spring and downward displacement.
Please note that these data were collected using the ‘10’ oscillation option, meaning that the Time/s column has recorded the time it takes for 10 oscillations to occur (so the period of one oscillation is a tenth of the time shown in the table).
The key piece of learning is that the period is independent of the amplitude used to initiate the oscillations. Note: all the observations obtained in Table 1 were collected by pulling the spring downwards. You will see that Trial no. 5 has a negative value, and the period is smaller – the negative value indicates that the trial is invalid, this is because the downward pull was a large one and the weighted spring hit the clamp, thus compromising the experiment.
The data set shown in Table 2 were collected using an upward displacement, and here the negative sign has been used to indicate this.
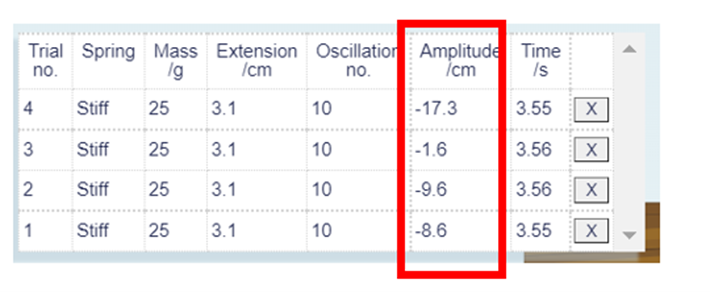
Table 2 Data collected using the stiff spring and a series of upward displacements.
Task 2
In Task 1 the students discovered that the period of oscillation is independent of the size of the displacement amplitude. In Task 2 they then explored the effect of increasing mass on the period and how both the mass and period can be used to calculate the force constant.
Table 3 shows the effect of increasing mass on the period of oscillation for the stiff spring.
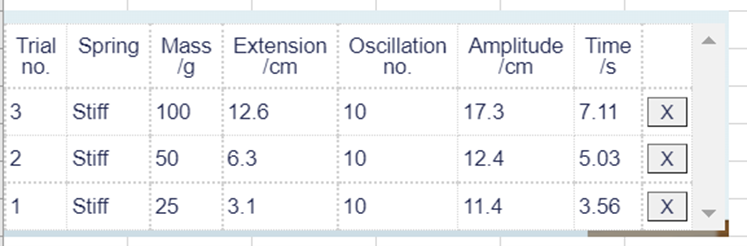
Table 3 The effect of increasing mass on the period of oscillation.
The key piece of learning here is that the period increases with the mass added to the spring.
The observations in Table 3 can be used to calculate the spring force constant. This is done by plotting the square of the period against mass and using the slope of the graph to calculate the force constant. However, before this can be done the data in Table 3 needs to be transformed, so the period is expressed as T2 and the mass in kg (Table 4).
|
mass (kg) |
T (s) |
T2 (s2) |
|
0.025 |
0.356 |
0.126736 |
|
0.05 |
0.503 |
0.253009 |
|
0.1 |
0.711 |
0.505521 |
Table 4 Transformed data from Table 3.
The transformed data in Table 4 is plotted in Figure 7.
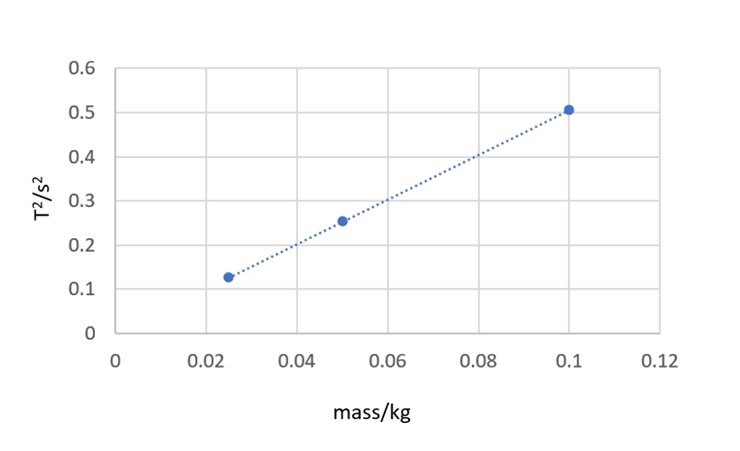
Figure 7 The square of the period for the stiff spring is plotted against the mass. The slope has a value of approximately 5.05.
The slope of the graph shown in Figure 7 has a value of 5.05. This can now be used to calculate the force constant of the stiff spring by using the following equation:
k = 4π2/slope = 39.44/5.05 = 7.81 N/m
The equation can be used to predict how changing mass or the stiffness of a spring will affect the period of oscillation. An increase in mass (m) will lengthen the period whereas an increase in stiffness (k) will decrease it. The latter can be demonstrated by comparing the slopes of the stiff and soft springs on the same graph.
Previous: Appendix 1 Next: Lesson: Simple harmonic motion