2 Hearing loss and the ear

Activity 3 How loud?

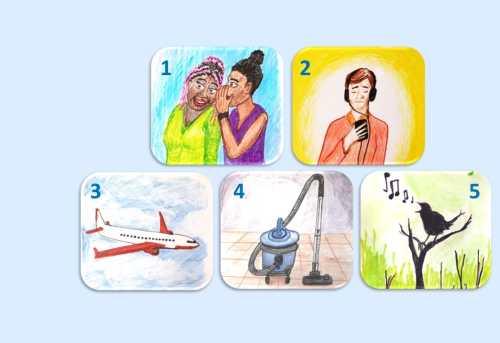
Match these sounds to the decibels (dB).

Five hand-drawn pictures on a blue background. The pictures are numbered. Picture number 1 is of one women whispering to another. Picture 2 is of a young man with headphones in listening to music on his mobile phone. Picture number 3 is of a large aeroplane flying in the clouds. Picture 4 is of a vacuum cleaner with a nozzle. Picture 5 is a cartoon of a bird chipping birdsong.
Figure 3 Five different sounds with five different decibel levels.

Using the following two lists, match each numbered item with the correct letter.

  1. 35dB

  2. 110dB

  3. 120dB

  4. 60dB

  5. 10dB

  • a.1 Whisper

  • b.2 Headphones

  • c.4 Vacuum cleaner

  • d.5 Birdsong

  • e.3 Jet engine

The correct answers are:
  • 1 = a
  • 2 = b
  • 3 = e
  • 4 = c
  • 5 = d
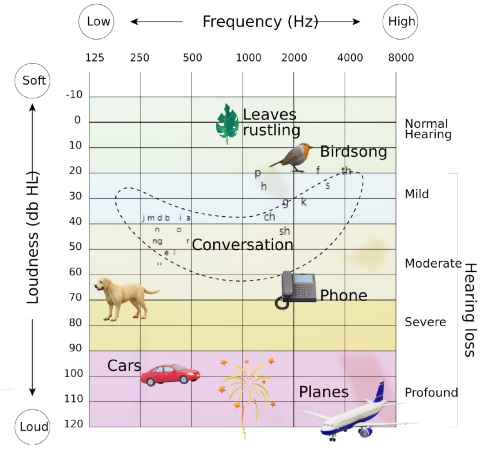
On the top of the audiogram is a scale called ‘Frequency (Hz)’. On the far left of the audiogram it says ‘Low’. On the far right of the audiogram it says ‘High’. Underneath, the measures listed are 125 Hz, 250 Hz, 500 Hz, 1000 Hz, 2000 Hz, 4000 Hz, 8000 Hz. On the left hand side, going down the graph, the heading is ‘Loudness (db HL)’. At the top of the audiogram it says ‘soft’ at the bottom it says ‘Loud’. The measures, going from top to bottom, are -10, 0, 10, 20, 30, 40, 50, 60, 70, 80, 90, 100, 110, 120. On the right hand side of audiogram is a heading which says ‘hearing loss’. The measures, from top to bottom are ‘Normal hearing’, ‘Mild’, ‘Moderate’, ‘Severe’, ‘Profound’. In the middle of the audiogram, on the grid, are pictures. The picture of ‘Leaves rustling’ appears on the normal hearing line which is 0 db and 1000 Hz. Birdsong appears at 2000 Hz, just under normal hearing, and in 10-20 db. Conversation is in a wide range between 25-65 dB, between 200-5000 Hz, and Moderate through to Moderate in the hearing loss measure. The image of a phone is 2000 Hz, 60-70 dB and just below Moderate hearing loss. A picture of a dog appears at 200 Hz, 70 dB, appearing just above the Severe mark. The image of a car appears at around 400 Hz, 100 dB, and in the profound category. Fireworks appear at 1000 Hz, 100 dB, and in the profound section. Planes appear at 4000 Hz, 120 dB, and at the bottom right of the graph in the profound category.
Figure 4 audiogram

Figure 4 shows the different stages of hearing loss on the audiogram and what sounds are affected depending on the hearing loss.

An audiogram is used to illustrate how much you can or can’t hear. Usually this test will be undertaken by an audiologist.

The numbers presented are decibels (dB). They illustrate the noise volume.

Ever wondered why?
...workers in noisy environments must wear ear defenders? Your hearing can be significantly affected when listening to sounds between 90dB and 110dB for long and frequent periods of time. If you are surrounded by 120 -140dB of sound you will damage your hearing instantly. Once the damage is done there is no going back!

1.3 Deafness at school

3 Different types of hearing loss