
Practical activity (Determining a spring force constant)
Practical activity
In this experiment you will measure the spring force constant of a spring. There are three springs to choose from, each with a different degree of stiffness. Your teacher may ask you to measure the spring constants for all three or may ask you to focus on a particular spring.
Copy the following table headings into your laboratory notebook:

Figure 3 Table headings used by the spring mass system experiment.
You will use this to record the data generated by the spring mass system. The initial reading is the length of the spring in centimetres at rest before any weights are added to the spring.
|
If the initial reading of a spring is 12 cm and 15.5 cm after the application of a 50 g weight, by how many centimetres has the spring been extended by the weight applied? |
Once you have accessed the Spring mass system application homepage ( do not do this until you read the following instructions thoroughly), select the ‘Determining a spring force constant’ option and enter the experiment. Your first task is to select a spring (you have a choice of a soft, medium or stiff spring). Once you have selected a spring, record the initial reading before adding any weights to extend it. Weights are then added sequentially, starting with 50 g (this is the weight of the ‘weight holder’) and then adding more weight in 50 g increments until the final weight of 250 g is reached.
Once you have collected your observations you will need to create a new table in your laboratory notebook where the gram (g) weights are converted to force values in newtons (N) and the extension values in centimetres (cm) are converted to metres (m).
If you are unfamiliar with the relationship between mass and force, at sea level 1 kg of mass is equal to a force of 9.8 N, so 100 g is equal to 0.98 N.
|
What is 250 g in newtons? |
Once you have converted your values into newtons and metres, plot a graph of force against extension for your chosen spring, and then fit a best fit line running through the plotted data points – such as the example shown in Figure 4.
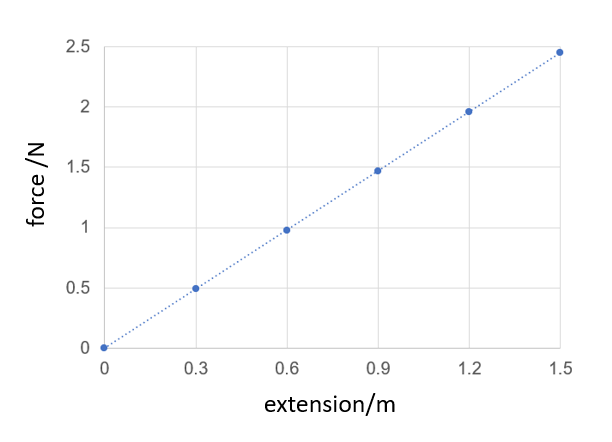
Figure 4 A graph showing the extension of a spring as a function of the applied force.
The slope of your graph is a measure of the stiffness of the spring. The data plotted in the example shown in Figure 4 is linear, meaning that the limit of proportionality has not been reached and because the relationship between applied force and extension is proportional, Hooke’s law can be used to calculate the spring force constant.
So, if a force of 2.45 N (the equivalent for 200 g) produces an extension of 1.2 m, the slope is calculated by dividing 2.45 N by 1.2 m – giving a value of 1.635 N/m.
|
Look at the graph plotted in Figure 4. Which variable has been plotted against each axis? |
The normal convention when plotting data is to plot the dependent variable on the y-axis and the independent variable on the x-axis. However, because the spring force constant is expressed as N/m, this convention is reversed when applying Hooke’s law, such that the dependent variable (extension, m) is now plotted on the x-axis and the independent variable (force, N) on the y-axis and hence, the resulting slope is expressed as N/m.
|
Spring mass system |
|
Click on the icon below to access the Spring mass system application homepage in the OpenSTEM Africa Virtual Laboratory. Watch the introductory video before entering the experiment.
|

Previous: Background Next: Summary