Practical activity (Exploring the properties of electrons using a fine beam tube)
Practical activity
In this practical activity you will use a fine beam tube (FBT) to investigate the behaviour of electrons in a magnetic field. Before you get started with the practical activity the following section provides more detail about the apparatus you will be using.
Fine beam tube
Figures 3 and 4 illustrate the components that make up a FBT and these are also listed below:
- Glass container: containing very low-pressure hydrogen gas but no air. The beam is visible as photons are emitted if an electron collides with a hydrogen atom.
- Hot cathode: this is the source of the electrons used in the experiment, emitted when the cathode is heated by a small voltage – thermionic emission.
- Anode: a small metal cylinder vertically below the cathode.
- Beam: glows pale lilac when is greater than though can be very hard to see at low voltages.
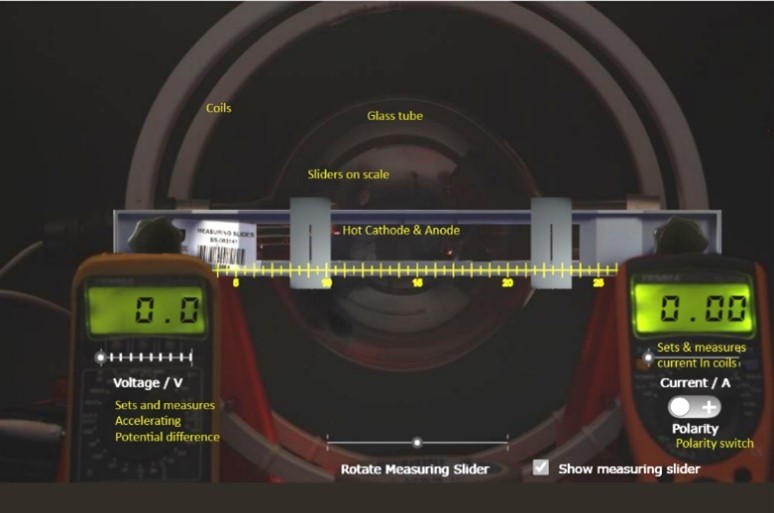
Figure 3 The fine beam tube from the application, with the beam turned off and measuring slider displayed.
External to the tube, you can see:
- Two coils in Helmholtz configuration.
- Accelerating potential/voltmeter. This potential difference (PD) is applied between the cathode and anode so that the anode is at a higher potential. This PD, , is shown on the digital voltmeter to the left.
- Current through coils, measured on this digital ammeter.
- Polarity switch, which reverses the direction of the current through the coils.
- Measuring sliders. Use these to line up with the circular beam or coil. The distance between them when lined up = the diameter of the circle. These can be rotated for convenience.
- Changing : this changes the accelerating PD in steps of approximately 20 V in the range – to 250 V.
- Changing : this alters the current through the coils that creates the magnetic field.
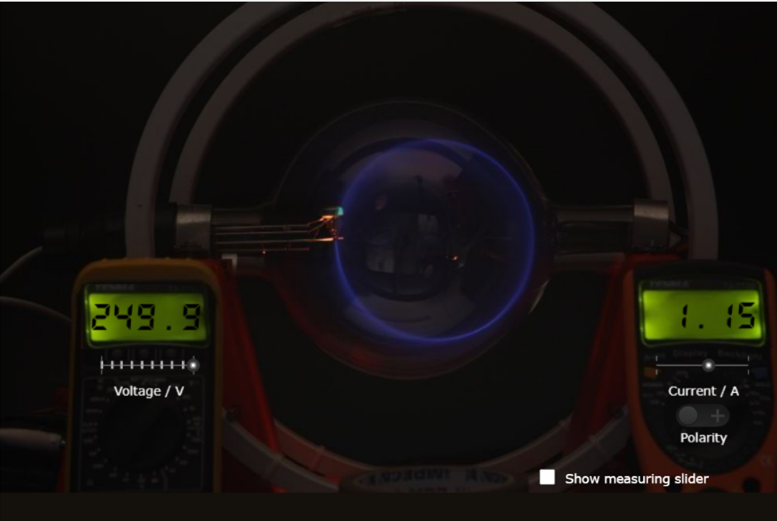
Figure 4 The fine beam tube from the application in operation with a lilac circular beam shown.
Figure 5 shows a photograph of the actual FBT used in this application.
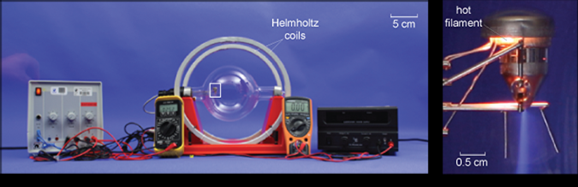
Figure 5 From left to right you can see the power supply used to accelerate the electrons, voltmeter (measures voltage), fine beam tube within the two coils, ammeter (measures current) and power supply to the coils. On the far right you can see a close-up of the lilac beam emerging downwards from the hot cathode (its location within the glass tube is indicated by the white rectangle).
Before moving onto the next section, make a sketch of and label the equipment shown in Figure 5 in your laboratory notebook.
Investigating the beam
In this part of the investigation, you will qualitatively investigate the electron beam in the FBT. Read the following instructions before accessing the FBT application.
- Start with the accelerating PD = 0 V and increase the PD up to 250 V using the slider on the voltmeter. The polarity switch should be to the left, in the + position. Describe and explain the beam.
- Now increase the current, using the slider on the ammeter, keeping the PD at 250 V. Describe and explain what happens to the beam
- Reduce the current and PD to zero. Reverse the polarity of the switch to the – position. Increase the PD to 250 V then current and describe how the beam changes
Expected observations:
- You should see the lilac electron beam pointing vertically downwards. It is brighter at higher PDs. The electrons are accelerated for a short distance through the anode and continues downward without any magnetic forces acting on it, so the electrons follow a straight path.
- The current causes the beam to curve to the right. At low currents, the beam forms a circular arc but the magnetic is not strong enough to pull the beam into a circle. As the current increases, the force becomes strong enough to pull the beam into a circle, which gets smaller as the current/force increases.
|
As the beam is deflected to the right of the screen and the electrons are moving vertically downwards, what is the direction of the magnetic field? |
- The beam is now deflected in the opposite direction and leaves the magnetic field. The current in the coils has reversed, which in turn reverses the direction of the magnetic field and the force on each electron.
|
Explain why the system only allows you to reverse the direction of the current when it has been reduced to zero? |
Making measurements with a circular beam in the FBT
In this part of the experiment you will take quantitative measurements in order to produce a graph of the results and calculate the charge to mass ratio, To make this clear, we will just call this number ratio.
In this experiment, there are three variables that can be changed and measured, current, voltage and beam radius. To make this a fair test, these are instructions to change the voltage, measure the beam radius whilst holding the current constant. This means that you are effectively seeing the change in the radius/forces on the electrons for electrons with a range of energies/velocities. The magnetic field between the coils is held constant.
- In your laboratory notebook, copy the table below:
Current I =
|
Voltage / V |
Left position /cm |
Right position / cm |
Beam Diameter / cm |
Beam Radius / m |
Radius2 / m2 |
|
|
|
|
|
|
|
- Turn on the apparatus and adjust the voltage to about 130 V, current to about 1.5 A so that you can see the electron beam circle. Write down the value of the current with your table and the voltage in your table.
- Turn the slider display on and move the left-hand slider with its right edge on the left side of the circle. You should be able to leave it there for the rest of the experiment. Record slider position in the second column. The markers on the slider scale are 0.5 cm apart, try to measure the positions to the nearest mm.
- Move the other slider so the circle is on its left-hand edge. Read and record that position in the third column.
- Work out the diameter by subtracting the value in the second column from the third.
- Now you need to work out the beam radius. Divide the diameter by 2 then convert the answer to meters (divide it by 100).
- For the final column, work out the radius squared in m2
By step 7, your data should look like this, with your own values. Note, the data in the table below is just an example.
Current I = 1.52 A
|
Voltage / V |
Left position /cm |
Right position / cm |
Diameter / cm |
Radius / m |
Radius2 / m2 |
|
130.0 |
10.3 |
16.0 |
6.7 |
0.0285 |
0.0081 |
|
|
|
|
|
|
|
Now repeat the measurements at higher values of the voltage. You can go up in steps of 20 V up to 250 V. You will move the right-hand slider each time to measure the positions.
Graph of the data
Now use your data to plot a graph. If you plot voltage against radius on a graph, you will get a curve. In fact, you can look for a clearer relationship.
Plot voltage on the vertical (y) axis against radius2 on the horizontal (x). You should be able to add a straight line of best fit.
|
Describe your graph. How would you describe the relationship shown? |
Calculating a value of the ratio from one row of data
To work out the ratio, you will use the following equation, remember that , the charge to mass ratio for an electron. is the magnetic field and is the radius of the beam.
You now need to calculate . The formula is
is called the coils constant. For the coils here, T m-1.
|
Rearrange the formula to give an expression for the ratio |
Now, go to the row with your largest value of . Use the values of and from the table and the value you have calculated for , to calculate the ratio.
Calculate the established value of the ratio with and
How close is your measured value to this?
Calculating a value for the ratio using the graph
Now that you have a complete table of results, you can plot a graph to work out the charge to mass ratio. This should give a more representative value that uses all of the measurements and reduces the uncertainty.
From the formula
You can write in a form though should be zero here, with V on the y axis and r2 on the x axis.
You should be able to see that is proportional to so a graph of against gives a straight line graph through the origin. The gradient will be the expression that multiples i.e.
|
How can you use the gradient to calculate the ratio? |
is the value that you have already calculated for the magnetic field. Calculate the gradient of your graph and use it to calculate the ratio.
As before, compare your value to the established value of the ratio , using
and
Now that you have read the instructions you are ready to enter the experiment.
|
Fine beam tube |
|
Click on the icon below to access the Fine beam tube application homepage in the OpenSTEM Africa Virtual Laboratory. Watch the introductory video before entering the experiment.
|

Previous: Background Next: Summary