Practical activity (The human heart)
Practical activity
Designing your experiment
Let’s carry out an experimental investigation to see if a subject’s heart rate changes in response to different exercise activities. The subject participant may be you or your classmate.
|
What hypothesis is your experiment going to test? |
|
What is the independent variable (the variable you are going to change) for your experiment? |
|
What is the dependent variable (the variable you are going to measure) for your experiment? |
Any type of experiment using a human as its subject must be ethical. The participant needs to be fully informed about what will happen during the experiment, the purpose of the experiment and how the experimental data will be used. The experiment should only take place after the participant has given their consent. The participant has the right to decline participating in the experiment and to withdraw from the experiment, without providing a reason.
Measuring the pulse of a subject
You can measure your own (or your classmate’s) heart rate indirectly by measuring their pulse rate. You should be able to feel the subject’s pulse, by placing your two fingers on the subject’s wrist (radial pulse) or neck (carotid pulse), as shown in Figure 8. (Note: the experimenter should not use their thumb to measure the subject’s pulse as their thumb also contains a pulse.) Record in your notebook which pulse you are going to measure.

Figure 8. Measuring a subject’s (a) radial pulse or (b) carotid pulse
Once you have decided how you are going to measure heart rate it is important for the experimenter to use the same method throughout the experimental trials.
Apart from the independent variable in the experiment, it is important to try and control other variables during the experiment. Otherwise, the experimenter may not be able to determine if any changes observed in the dependent variable are due to changes in the independent variable or changes in another uncontrolled variable during the experiment. There may be variations in a subject’s radial pulse rate and their carotid pulse rate.
Using a stopwatch, timer or stopwatch function on your phone, the experimenter should measure the subject’s pulse rate as the subject is sitting down for 1 minute. This is the subject’s resting heart rate.
Next, ask the subject to stand up and again, measure their pulse rate for 1 minute.
For the next trial, ask the subject to walk on the spot for 1 minute and then measure their pulse rate for 1 minute.
For the final trial, ask the subject to jog on the spot for 1 minute and then measure their pulse rate for 1 minute.
Complete your results table as shown below.
Results Table: Heart rate of a subject following different exercise activities
|
Exercise activity trial |
Exercise level |
Rate (bpm) |
|
Sitting down (at rest) |
LOW (1) |
|
|
Standing up |
LOW (2) |
|
|
Walking on the spot for 1 min |
MEDIUM (3) |
|
|
Jogging on the spot for 1 min |
HIGH (4) |
|
Interpreting your results and evaluating your experimental design
|
Have your results confirmed your research hypothesis? |
|
How do your findings compare with another group in your class? |
|
How could you improve the reliability of your experimental results? |
You could pool results from the different experiments taking place using different subjects in your class and then calculate mean average heart rates for this class data. It would be really useful to see if the heart rates of your classmates respond in the same way to exercise.
You could also plot your results using a graph and use statistical tests to see if any difference in heart rates for different exercise activities is statistically significant or not.
Discuss with your classmates how you might improve your experimental design before reading the suggestions below.
- If you have time, you could maybe measure the carotid pulse rate of the subject if you measured the radial pulse rate of the subject, or vice-versa to see if you obtain similar results.
- You could maybe measure the heart rate of the subject using a heart rate monitor app on a smart phone or smart watch.
- You could test further exercise activities such as walking up some stairs or sprinting for a minute to see if the results obtained agree with your experimental hypothesis.
- You could carry out further experiments with Senior High School Year 1 students and with students from other High Schools in Ghana, to increase the sample size for your experiment.
Now that you have completed your experimental work, the following sections of this lesson will explore further some of the physiological properties of the heart related to exercise.
The effects of exercise on a subject’s heart rate
When you exercise, your leg and arm muscles require more oxygen for respiration. Also, waste products such as lactic acid start to build up in these muscles. For both these reasons, the muscles need more blood to transport the oxygen and to remove the lactic acid. To increase the blood flow to these muscles, your heart needs to pump blood faster – your heart rate increases.
- Let’s look at the heart beating faster. Use the plus button at the bottom of the screen to increase the heart rate to 200 bpm.
We have seen why it is important for the heart rate to increase in response to exercise. Some people have a resting heart rate above 100 bpm – this condition is called tachycardia.
- Let’s look at the heart beating more slowely. Use the minus button at the bottom of the screen to decrease the heart rate to 60 bpm.
Some people have a resting heart rate below 60 bpm – this condition is called bradycardia.
Blood flow through the heart
We are now going to consider the journey that blood takes through the heart (Figure 9). Click on the ‘Show Blood Flow’ button. You will see some blue and red arrows appear. Again, you may wish to rotate the heart to getter a better view of the atria, ventricles and blood vessels.
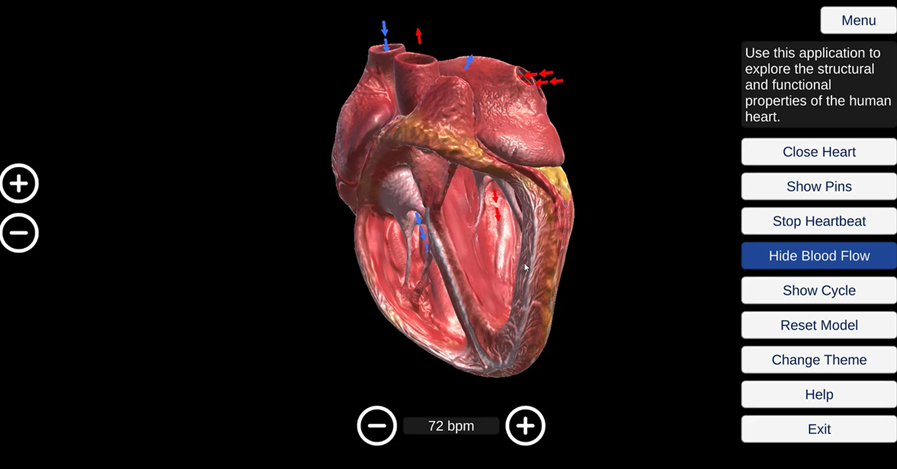
Figure 9. The circulation of blood through the chambers and blood vessels of the heart.
The blue arrows represent blood containing low oxygen levels while the red arrows represent blood containing high oxygen levels. The direction of the arrows indicates the direction in which the blood is flowing.
|
Which side of the heart contains the blood which is low in oxygen levels? |
Let’s consider the blue arrows first. We can see that the blood low in oxygen levels enters the right atrium of the heart through the superior and inferior vena cavae. When the right atrium contracts, the blood then moves from the right atrium into the right ventricle. When the right ventricle contracts, the blood moves into the pulmonary artery and is taken to the lungs, where it will become more oxygenated.
You will recall that the atria have thinner walls than the ventricles. This is because the atria only need to contract to move blood into the ventricles below them using gravity so do not need thick muscular walls and therefore have thin walls. However, the ventricles need to force blood against gravity from the ventricles up into the arteries located above the heart and therefore require thick muscular walls.
We can see this blood with higher oxygen levels, as represented by the red arrows, returning through the right and left pulmonary veins and into the left atrium of the heart. When the left atrium contracts, the blood then moves from the left atrium into the left ventricle. When the left ventricle contracts, the blood moves into the aorta and is taken to all the other organs of the body (except the lungs) where it will release oxygen. This blood with lower oxygen levels will then return to the heart through the vena cavae, to start the cycle again.
Earlier, we saw that the left ventricle has a much thicker wall than the right ventricle. The left ventricle needs to pump blood through the aorta, which takes blood to all organs of the body (except the lungs) whereas the right ventricle pumps blood into the pulmonary artery, which takes blood to the lungs. The lungs are located much closer to the heart than other organs of the body.
The cardiac cycle
However, as we can see from the animation, the heartbeat is co-ordinated so that blood enters both the right and left atria at the same time from the veins (vena cavae and pulmonary veins, respectively). This is known as diastole.
Then, both atria contract at the same time so that blood enters the right and left ventricles at the same time. This is known as atrial systole.
Then, both ventricles contract at the same time so that blood is pumped through the arteries (pulmonary arteries and aorta) at the same time. This is known as ventricular systole. This series of three events make up the cardiac cycle.
|
For a heart beating at a rate of 72 bpm, how long does one heartbeat (or cardiac cycle) take? |
The heart valves ensure that blood flows in one direction during the cardiac cycle. During atrial systole, the atrio-ventricular valves open and blood flows from the atria into the ventricles. The semilunar valves remain closed.
During ventricular systole, the atrio-ventricular valves close (this creates the ‘lub’ sound of the heartbeat), preventing backflow of blood from the ventricles to atria and the semilunar valves open, ensuring that blood is forced into the arteries.
During diastole, the semilunar valves close (this creates the ‘dub’ sound of the heartbeat). The atrio-ventricular valves remain closed.
The double circulation
Humans have a double circulatory system – a pulmonary circuit of blood vessels carrying blood between the heart and lungs and a systemic circuit of blood vessels carrying blood between the heart and the other organs of the body (except the lungs). This is illustrated in Figure 10.

Figure 10. The double circulation. Blood high in oxygen is coloured red and blood low in oxygen is coloured blue.
The cardiac cycle in focus
We are now going to explore the events happening during the cardiac cycle in more detail. Click on the ‘Show Cycle’ button. To help us follow the events, decrease the heart rate to 1 bpm. You will see six traces, represented by different colours, during two cardiac cycles. Follow the traces with the beating heart as shown in Figure 11.

Figure 11. The cardiac cycle
The top three traces measure the pressure within the aorta, ventricles and atria, respectively. The orange line represents pressure within the atria. You can see that there is a small peak in this trace, during atrial systole, when the atria contract in the animation. The trace then levels out, as the atria relax, during diastole. The blue line represents pressure within the ventricles. There is a peak in this trace when the ventricles contract during ventricular systole. This trace then levels out as the ventricles relax, during diastole.
|
Why are there differences between ventricular pressure and atrial pressure during the cardiac cycle? |
The red line represents pressure within the aorta. Notice how the pressure in the aorta increases as blood is forced from the left ventricle into the aorta during ventricular systole.
The pink trace is measuring the volume within the ventricles during the cardiac cycle.
The green trace is an electrocardiogram, or ECG, showing the electrical activity changes taking place during the cardiac cycle. Finally, the grey line represents the ‘lub’ and ‘dub’ sounds of the atrio-ventricular valves and the semilunar valves closing respectively, during the cardiac cycle.
Previous: Background Next: Summary