

1.1 Incidence and prevalence
The incidence of an infectious disease is the rate at which new infections occur within a defined period of time. For a non-infectious disease the rate would be given as the number of newly diagnosed cases in a period of time. For many epidemiological studies the incidence is given as the number of new cases per year, per 100,000 population. For example, the incidence of lung cancer in the UK between 2016−2018 is given as 70 cases per 100,000 people per year. The incidence of this condition is highly dependent on the age of population group studied. For this reason, incidence rates are often ‘age standardised’ so that comparisons can be made between countries with different demographic profiles.
-
Apart from age, what other factors might influence the incidence of lung cancer?
-
You may have thought of gender, ethnic group, geographic location and social factors such as smoking. Many of these factors can be interrelated.
As you can see, it is important to define exactly what population is being studied and when. If it is not stated, it often means the annual incidence in the entire population of a country or region.
An alternative measure of the occurrence of disease is prevalence. This gives the total proportion of the population that are affected at any one point in time. It can be expressed as the number of affected individuals per 100,000 of the population. For more common diseases it may just be given as the percentage of the population affected at any one time point. Chronic conditions (e.g. diabetes) may last for many years, in which case the prevalence at any one time will be greater than the annual incidence.
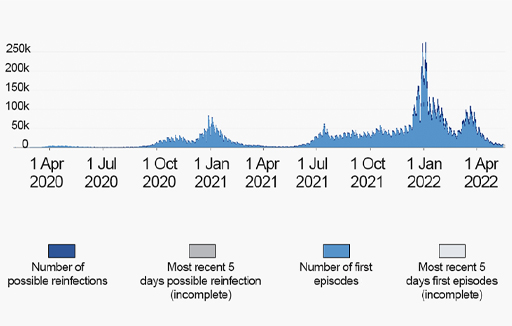
For acute infectious diseases such as COVID-19, which usually last for 7−10 days, the weekly incidence of the disease is a more useful measure, since it can show how the epidemic is changing from one week to the next. However, if you look again at the incidence of SARS-CoV2 cases in the UK (Figure 1) you will see that the figures actually show the daily incidence. It is therefore important to look at the period of time for which the incidence rate is quoted. For example, if the daily incidence of infection over a period of time is 10,000 cases, then the weekly incidence will be 10,000 x7 = 70,000.
Activity 1 Weekly incidence of disease
An interesting point can be seen in the data on this graph in relation to the weekly incidence of disease – can you see what it is? How could it be explained? Note your thoughts in the box below
Answer
The bar chart shows the incidence of new infections detected each day, but it also shows a distinct weekly pattern (the regular notches on the overall profile). There are two possible explanations for this pattern: either infection rates vary on a weekly basis, depending on where people were located and what they were doing; or a more likely explanation is that the laboratories that were testing the specimens, handled or reported more cases during weekdays than at weekends.
Sometimes, during the epidemic in the UK, the level of infection was reported as prevalence, for example, ‘At this time, 1 person in every 100 people in the UK has a COVID-19 infection.’ It is important to see the distinction between incidence and prevalence, since it can lead to confusion in understanding the absolute numbers affected. For example, suppose the incidence of new infections is 10,000 per day and the average duration of the infection is 10 days, then the prevalence during this period will be 10,000 x10 = 100,000.
For an acute infectious disease, incidence and prevalence are both useful measures of how an epidemic is progressing. But, for many other conditions, incidence and prevalence give different types of information – beware and be aware of the distinction.