

2.1 Herd immunity threshold
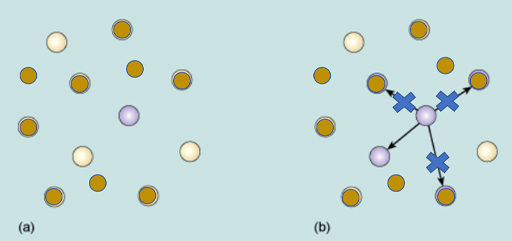
In section 1, we discussed disease susceptibility and the proportion of the population who are susceptible. This value is designated by a variable ‘S’. In the illustrated example (Figure 5a) in a population of 12 individuals 9 are resistant and 3 are susceptible.
S = 3/12 = 0.25 and the proportion resistant = 1 –S = 0.75
Recall that if RT <1 then an infection will die out. The herd immunity threshold and the critical immunisation threshold occur when RT =1. The value can be calculated from the basic reproduction number R0.
HIT = 1 – 1/R0
Let us consider how this works for a disease with R0 = 4
HIT = 1 -1/4 = 0.75
If this is now expressed as the percentage of the population that must be resistant to stop a disease from spreading:
HIT = 0.75 x100 = 75%.
For a diagrammatic representation of this example, see Figure 5(b). In this case R0=4 and there is only one secondary infection (RE =1), because 3 of the 4 potential effective contacts are resistant.
There is some simplification in the calculation of HIT, since it assumes that a person is either completely susceptible or totally resistant. In practice resistance develops over time following infection or vaccination, and the level of resistance can wane. Nevertheless, considering individuals to be susceptible or resistant is useful for modelling epidemics and planning vaccination programmes.