
4.1 Factors leading to the overuse of antibiotics
In the UK, antibiotics can only be obtained on prescription from a doctor. However, overprescription is a problem and online sales of antibiotics can circumvent regulation. In other countries, the unregulated, over-the-counter sales of cheap antibiotics allow people to
In agriculture, antibiotics are mainly used to keep animals healthy and to promote growth (Figure 5). The rising global demand for a meat-based diet has led to more intensive, large-scale farming with animals reared in confined spaces where they are at greater risk of infection. Under these conditions, the demand for antibiotics is high. In some countries, more antibiotics are consumed by animals than by people. For example, in the USA, 70% of medically important antibiotics are consumed by animals.

In the next activity, you will consider how these factors might influence the consumption of antibiotics in different countries.
Activity 4 Comparing antibiotic consumption in different countries
In this activity, you will compare antibiotic consumption in two HICs – the UK and the USA – and two
Part A
Figure 6 shows the consumption of antibiotics by country.
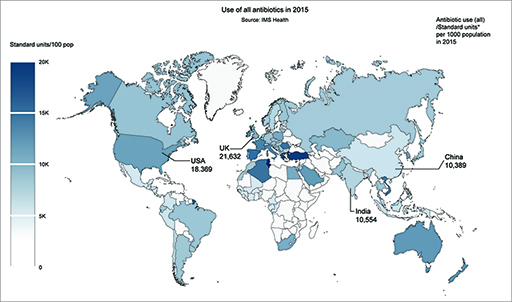
Complete the table of antibiotic use using the information given on the map in Figure 6. If you want to use the larger version of the figure, open it in a new browser tab or window so you can look at it alongside the activity.
| Country | Antibiotic use (all) /standard units* per 1000 population in 2015 |
|---|---|
| China | |
| India | |
| UK | |
| USA |
- Which of these countries had the highest consumption of antibiotics per 1000 population in 2015 and which country had the lowest consumption?
Answer
- The UK used the most antibiotics at 21 632 standard units per 1000 population. China used the least antibiotics at 10 389 standard units per 1000 population.
| Country | Antibiotic use (all) /standard units per 1000 population in 2015 |
|---|---|
| China | 10 389 |
| India | 10 554 |
| UK | 21 632 |
| USA | 18 389 |
- Were you surprised by which of the four countries had the highest antibiotic consumption per 1000 population in 2015? Why or why not?
Answer
- Many different factors affect antibiotic consumption at a country level. For example, access to healthcare, availability and cost of drugs and public attitudes. In LMICs, poor access is probably a significant factor in antibiotic use. Although the UK and the USA have comparable levels of antibiotic use per 1000 population, the UK possibly has fewer barriers to health care and antibiotics are readily prescribed.
Note that, although the UK has the highest antibiotic use per 1000 population, it has the lowest total antibiotic use. Both India and China used ten times more antibiotics in 2015 than the UK. This is due to their larger population size.
Part B
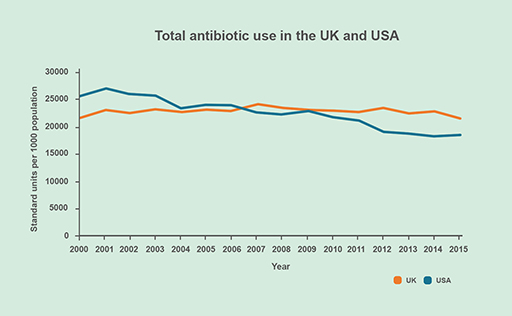
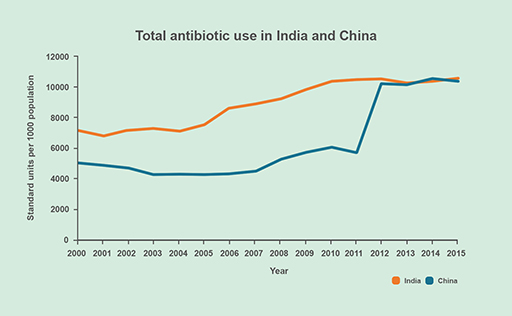
Figures 7a and 7b show the consumption of antibiotics in the four countries between 2000 and 2015.
Answer the following questions about antibiotic use over this time period.
- In which of these countries did antibiotic use rise?
- In which country did antibiotic use fall?
- Which country maintained similar levels of antibiotic use?
Answer
- India and China
- USA
- UK
- Can you make a general observation about the use of antibiotics in different countries?
Answer
- Antibiotic use varies between countries and within a country as demand rises or falls.
Part C
The table below shows projected change in antimicrobial consumption in China, India, the UK and the USA by 2030.
| Country | Projected change in antimicrobial consumption by 2030 (%) |
|---|---|
| China | 13 |
| India | 18 |
| UK | 1 |
| USA | 2 |
- Which country is projected to have the greatest increase in antimicrobial consumption for animal use by 2030? What might be driving the increase?
Answer
- India is expected to increase its antimicrobial consumption by 18% over this period. Five LMICs, including India and China, are expected to account for one-third of increased antibiotic consumption in animals by 2030.
This will be driven by consumer demand for meat products and hence more intensive farming practices which rely heavily on antibiotics. The potential consequences for antibiotic resistance are considerable (van Boeckel et al., 2015).
Activity 4 revealed the extent to which antibiotics are used by people and for animals. The agricultural use of antibiotics is of particular concern because studies have shown that the