

4 Graphical representation of waves
As you learn more about waves and the different situations in which they occur you will see that it is convenient to represent waves graphically. We can plot a wave as a graph in two ways: as a function of distance and as a function of time. It is important to appreciate the difference between them and the properties of the wave that are represented in both.
Taking the example of a stone splash in a pond, if we take a snapshot of the wave on the surface of a pond at a fixed point in time, such as a freeze frame of Figure 2, and plot the vertical position or displacement of a point at the surface as a function of distance from the point where the stone was dropped, we have a wave represented as a function of distance:
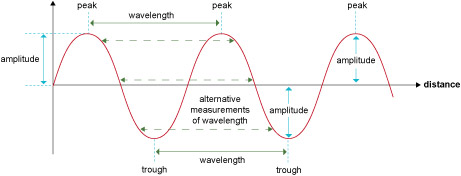
In the case of the stone splash, the vertical axis represents the displacement of the water from the undisturbed water line, but as you encounter waves in other situations, you will come across different units on the vertical axis such as, for example, intensity or voltage. For this reason the vertical axis is unlabelled in Figure 5, as it represents the generic case of any wave that is plotted as a function of distance.
When a wave is plotted with distance on the horizontal axis, the distance from one peak to the next, or one trough to the next, marks one complete cycle, and this distance is known as the wavelength. Note that the peak to peak or trough to trough are merely the easiest places to measure the wavelength or the period. Any full cycle will do, as shown by the dashed lines in Figure 5. In other words, you can measure the wavelength or period as the distance between any pair of equivalent points, that is, points where the wave has the same 'height' and is changing in the same way (i.e. the gradient is either positive for both points or negative for both points).
The maximum vertical displacement of the wave from the undisturbed surface is the amplitude.
We can also plot a wave as a function of time. Using the same example of the stone splash in a pond, if we now focus on a point on the surface at a fixed distance from where the stone was dropped, such as one of the green points in Figure 3, and plot the vertical displacement as a function of time, we have a wave represented as a function of time:
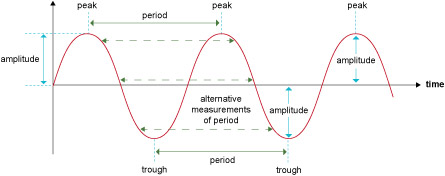
When a wave is plotted with time on the horizontal axis, the time taken from one peak to the next, or one trough to the next, marks one complete cycle, and this time is known as the period. As in the previous graph, the maximum vertical displacement of the wave from the undisturbed surface is the amplitude.
So the definitions of wavelength and period are rather similar. The wavelength is a distance and refers to points separated in space but measured at a fixed instant in time; the period is a time interval and refers to instances separated in time but measured at a fixed point in space.