

People and rewilding
2 Who do we work with?
2.2 Deciding who to work with
Rewilding is inclusive and embraces the role of people in the rewilding process. But how do those managing a rewilding initiative identify the relevant people? Who should be engaged first? And with whom should they establish more formal partnerships and for what purpose?
There are different approaches that can be taken to identify stakeholders – people who can influence or who are influenced by rewilding.
Early adopters
Rewilding takes an opportunity-driven approach. In terms of engaging stakeholders, this means finding those who are inspired by the concept, or who already understand the benefits of rewilding and want to collaborate.
The ‘diffusion of innovations theory’ – developed by American communication theorist and sociologist Everett M. Rogers (1962) – describes how ideas spread through society. In his well-known model, Rogers identified five key groups in this process: innovators, early adopters, early majority, late majority, and laggards.
Innovators are those who are doing something they believe to be new. This could be a new approach, idea or technology. They are willing to take the highest risks because they know that a new idea may fail but can also yield beneficial results. They often have an entrepreneurial mindset.
Early adopters are the people or organisations that look at what innovators are doing and act on their pioneering idea first. They see the potential benefits and are willing to take the risks that come with that idea.
The early majority wait until the benefits of those ideas are more proven and really become relevant in society, then join the new movement. Often these are governments, authorities, and larger institutions. The late majority follow after this, while laggards may never embrace the idea at all.
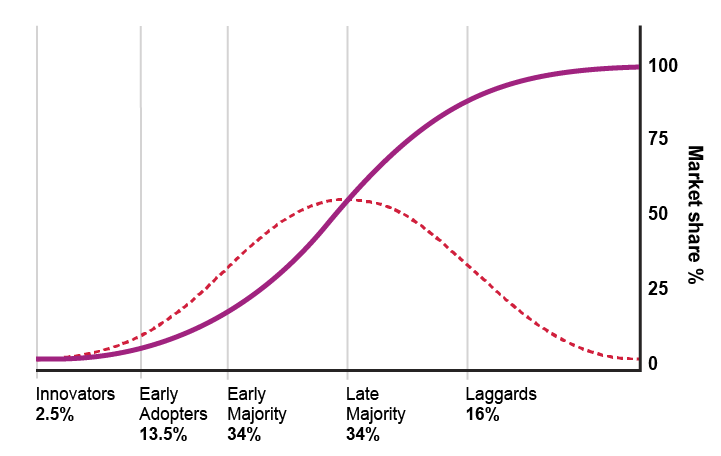
Graph illustrating the diffusion of innovations model, based on EM Rogers’ model.
Applying the terms of this model, rewilding can be seen as an innovation, and those who are quick to join the movement are early adopters. Working with early adopters can be a strategic way to move forwards quickly and focus resources on those that can help start bringing about real change for nature in Europe.
Mapping stakeholders
Another approach to identifying stakeholders is through a stakeholder analysis: a systematic mapping of the different people relevant to a rewilding initiative. Individuals and groups are plotted on a chart according to their interest in the work, and their influence on it (or how much it influences them) (Mendelow, 1991).
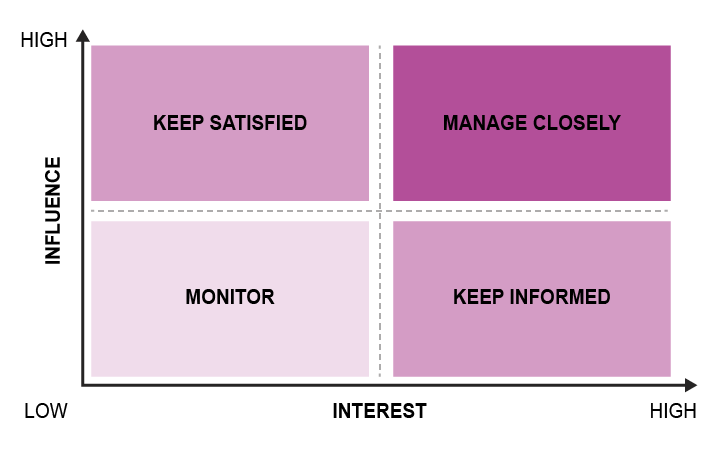
A simple stakeholder analysis, ranking each stakeholder depending on their influence in the subject and their interest in the subject.
The position of each person or organisation on the chart indicates how they should be engaged. Those with high interest and high influence should be the main focus of attention – they could even become strategic partners. Those who are less interested and less affected or influential may receive less attention.
Visual
The position of stakeholders in this kind of analytical chart will vary according to context and the rewilding actions or approaches that are set to be carried out.
|
Now consider which of these groups of people or organisations might be innovators, early adopters, or fall into a later category.
Which of the groups you identified would you work with first? Choose two or three we will come back to them later.
