
Data Analysis using Spreadsheets
4. Creating graphs and charts
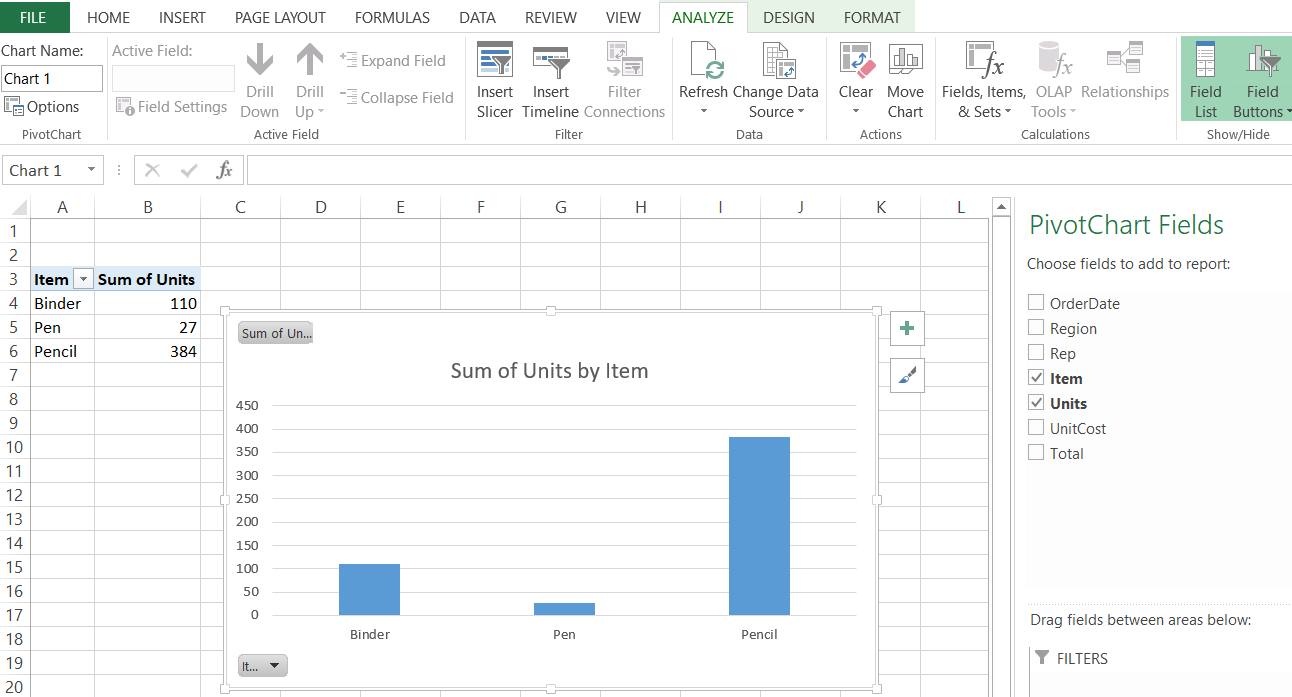
Select the data for which you want to create the chart. Choose Insert Tab then select the chart or click on the Chart group to see various chart types. Select the chart of your choice and click OK to generate the chart.
Now, after having finished this book, make sure to go back to the main page and complete activity 4.