
Resource 3: Charts and Graphs
| Goats | 21 | ||
| Chickens | 36 | ||
| Dogs | 8 |
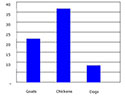 | Bar charts are good for representing categoric data (data that fits into separate groups). They are easy for pupils to draw, as they do not have to do calculations, but only read off 'how high' to go from the scale. Working choosing and using the correct scale is a key learning activity in early work with bar charts. Pictograms are a variation of a bar chart, where the pupil draws pictures (e.g 8 dogs) instead of a bar. |
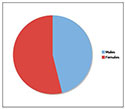 | Pie charts are good for representing categoric data (data that fits into clearly separate groups). They are especially useful for seeing what proportion of the whole is represented by a particular category. Making a pie chart is quite complicated for young pupils. They have to work out the relationship between the numbers they have counted, and the angle required in the pie chart. |
Resource 2: Data handling