
4 The statistics reports
4.1 Test statistics
Very important
These statistics are designed for use with summative iCMAs where students have just one attempt and complete that attempt
Average grade:
For discriminating, deferred feedback, tests aim for between 50% and 75%. Values outside these limits need thinking about. Interactive tests with multiple tries invariably lead to higher averages
Median grade:
Half the students score less than this figure.
Standard deviation:
A measure of the spread of scores about the mean. Aim for values between 12% and 18%. A smaller value suggests that scores are too bunched up.
Skewness:
A measure of the asymmetry of the distribution of scores. Zero implies a perfectly symmetrical distribution, positive values a ‘tail’ to the right and negative values a ‘tail’ to the left.
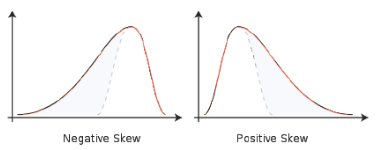
Aim for a value of -1.0. If it is too negative, it may indicate lack of discrimination between students who do better than average. Similarly, a large positive value (greater than 1.0) may indicate a lack of discrimination near the pass fail border.
Kurtosis:
Kurtosis is a measure of the flatness of the distribution. A normal, bell shaped, distribution has a kurtosis of zero. The greater the kurtosis, the more peaked is the distribution, without much of a tail on either side. Aim for a value in the range 0-1. A value greater than 1 may indicate that the test is not discriminating very well between very good or very bad students and those who are average.
Coefficient of internal consistency (CIC):
It is impossible to get internal consistency much above 90%. Anything above 75% is satisfactory. If the value is below 64%, the test as a whole is unsatisfactory and remedial measures should be considered.
A low value indicates either that some of the questions are not very good at discriminating between students of different ability and hence that the differences between total scores owe a good deal to chance or that some of the questions are testing a different quality from the rest and that these two qualities do not correlate well – i.e. the test as a whole is inhomogeneous.
Error ratio (ER):
This is related to CIC according to the following table: it estimates the percentage of the standard deviation which is due to chance effects rather than to genuine differences of ability between students. Values of ER in excess of 50% cannot be regarded as satisfactory: they imply that less than half the standard deviation is due to differences in ability and the rest to chance effects.
| CIC | 100 | 99 | 96 | 91 | 84 | 75 | 64 | 51 |
| ER | 0 | 10 | 20 | 30 | 40 | 50 | 60 | 70 |
Standard error (SE):
This is SD x ER/100. It estimates how much of the SD is due to chance effects and is a measure of the uncertainty in any given student’s score. If the same student took an equivalent iCMA, his or her score could be expected to lie within ±SE of the previous score. The smaller the value of SE the better the iCMA, but it is difficult to get it below 5% or 6%. A value of 8% corresponds to half a grade difference on the University Scale – if the SE exceeds this, it is likely that a substantial proportion of the students will be wrongly graded in the sense that the grades awarded do not accurately indicate their true abilities.
3 The responses report