My OpenLearn Create Profile
- Personalise your OpenLearn profile
- Save Your favourite content
- Get recognition for your learning
Already Registered?
Immunization
If you create an account, you can set up a personal learning profile on the site.
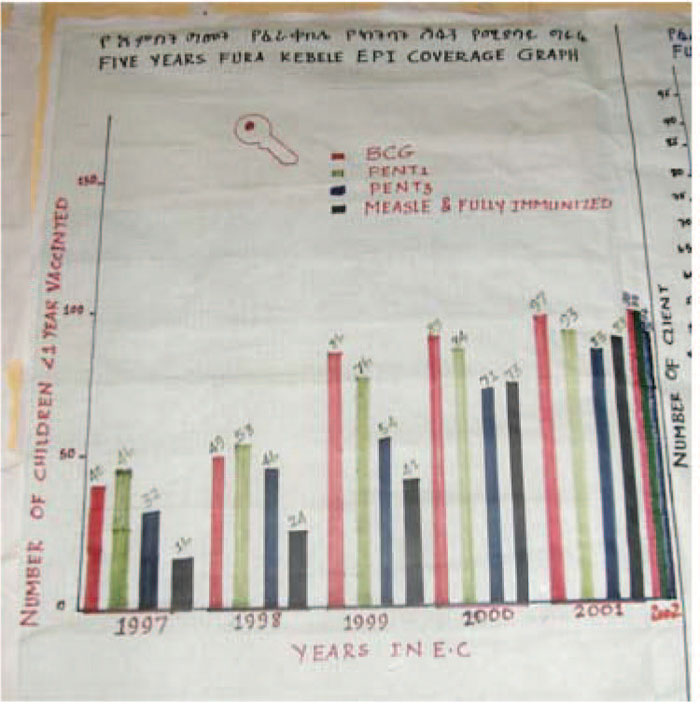
Figure 8.6 Chart showing immunization coverage rates during five years at Fura kebele, SNNPR, Ethiopia. The black bar to the right of each year shows the number of fully immunized children. (Photo: Basiro Davey)
For further information, take a look at our frequently asked questions which may give you the support you need.
If you have any concerns about anything on this site please get in contact with us here.