

2.2 External cost assessment of the European incineration directive
Under a directive of 1989, limits were placed on the atmospheric emissions from municipal waste incinerators operating within the EU (European Commission, 1989). In 1994 a draft directive was published which suggested, among other measures, tightening the emission limits. A selection of the 1989 limits and 1994 proposals are summarised in Table 7. Limits were also set for heavy metals but the combination of metals was different in the two directives.
Pollutant | 1989 limit (mg m–3 seven-day average) | Proposed 1994 limit (mg m–3 24-hour average) (ng m–3 for dioxins) |
|---|---|---|
| Dust | 30 | 10 |
| Organic carbon | 20 | 10 |
| Carbon monoxide | 10 | 50 |
| Dioxins | * | 0.1 |
| HCl | 50 | 10 |
| HF | 2 | 1 |
| SO2 | 300 | 50 |
| NOx | – | 200 |
| NH3 | – | 10 |
The UK’s Energy Technology Support Unit was asked by the European Commission to assess the costs and benefits of the proposed changes (Brown, 1996). Determining the private costs of the measure is beyond the scope of this course, but quantifying the externalities provides an interesting example of the use of this tool.
The assessment was based on the ExternE methodology, which can be summarised as:
- determining the emissions
- using dispersion modelling tools to determine the exposure to potential receptors
- evaluating the uptake pathways by receptors (for human exposure)
- using the dose–response function to assess the damage caused
- valuing the damage caused.
The emissions were calculated for a range of incinerator sizes fitted with several pollutant abatement systems. All the systems met the requirements of the directive, but the spread of technologies allowed comparisons between the systems common in different countries.
The dispersion modelling used standard atmospheric dispersion models that took account of both local (less than 50 km from the source) and long-range (more than 50 km from the source) receptors. As explained by Friedrich et al. (2001) the longer-range dispersion allowed the formation of secondary pollutants such as sulfate and nitrate aerosols and ozone to be covered.
The number of receptors affected by the pollutants depends on the height of the discharge and the number of people in the area. This was taken into account by considering three discharge heights (50 m, 90 m and 100 m) and three specific areas within the EU (Paris, Stuttgart and Birmingham).
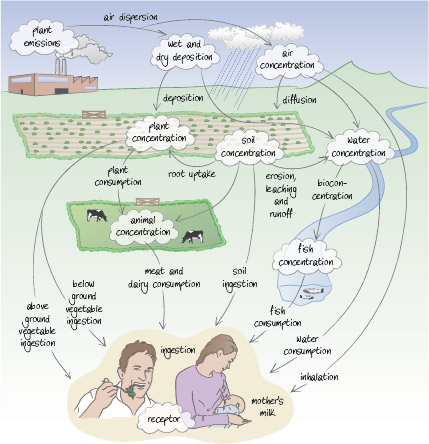
When modelling the uptake, the ExternE approach was adopted of assuming that for macro-pollutants, such as sulfur dioxide (SO2) and oxides of nitrogen (NOx), exposure is all due to inhalation. For micro-pollutants such as heavy metals and dioxins, multiple pathways must be taken into account. These pathways are summarised in Figure 1.1. In both cases, ExternE models were used to estimate the uptake of most substances and models from the US Environmental Protection Agency (USEPA) and the World Health Organization (WHO) were used for dioxins and mercury.
Once the doses were established, the ExternE methodology was used to determine the damage caused.
Valuation of the impacts was based on willingness to pay. In the case of mortality, it is important to stress that the sum does not represent the value of a life, which is priceless, but people’s willingness to pay for a reduction in the risk of death. This willingness is based on research using opinion surveys and monitoring expenditure on items such as nicotine patches among smokers and purchase of cars with airbags (when airbags were an optional extra rather than a standard fitting).
Results
The results in terms of damage cost per tonne of each pollutant emitted are shown in Table 8 for Stuttgart and a 90 m discharge height; the values for Paris are higher and those for Birmingham are lower due to differences in the exposed populations. Not surprisingly dioxins and heavy metals result in the highest damage costs and health impacts are far more important than building damage.
Pollutant | Impact | Damage cost (€ per tonne) |
|---|---|---|
| Dioxins | health | 2.43 × 10⁹ |
| Cadmium | health | 1.04 × 10⁶ |
| Arsenic | health | 1.27 × 10⁶ |
| Chromium | health | 1.05 × 10⁶ |
| Nickel | health | 2.14 × 10⁴ |
| Particulate matter | health | 147 500 |
| Oxides of nitrogen | health | 63 248 |
| Sulfur dioxide | health | 27 494 |
| Ozone | health and crops | 5 060 |
| Sulfur dioxide | buildings | 614 |
| Oxides of nitrogen | buildings | 307 |
Burning a tonne of waste releases different quantities of each pollutant so a more useful value is the damage caused per tonne of waste burned and this is shown in Figure 2. The range of values represents the different pollution abatement systems considered.
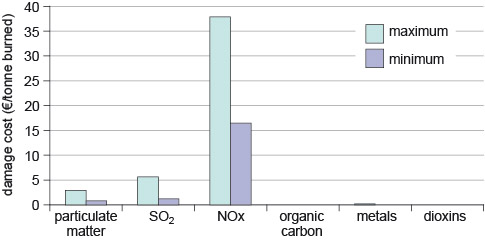
Figure 2 demonstrates the, possibly counter-intuitive, result that oxides of nitrogen are by far the most significant pollutant and that dioxins, although they have a much higher profile, have no detectable damage costs.