
What do you think of when you think about the internet? Do you think about some of the everyday ways in which you might use it: checking email, internet banking, an online supermarket order, ‘skyping’ friends? Or perhaps you think about the 'net' itself, the internet as a global infrastructure, connecting different places?
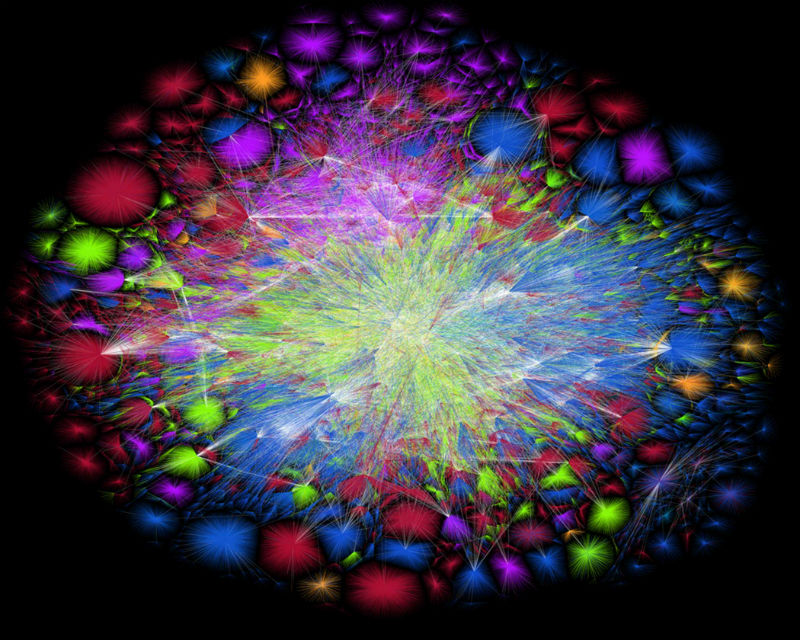
The image above is one of the most commonly used images of the internet, from The Opte Project. It was generated on 11 July 2015 and visualises connections between computers. The colours denote where the connections are:
Blue: North America
Green: Europe
Purple: Latin America
Red: Asia Pacific
Orange: Africa
White: the backbone of the internet: the most highly connected networks
The world online
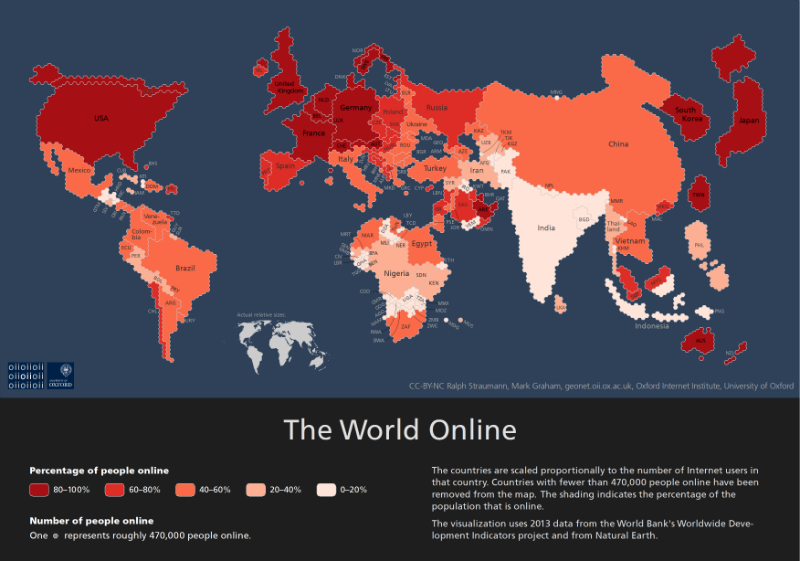
Wherever you are in the world, though, if you have a computer, a tablet at work or at home, a smartphone or a smart TV, then the chances are that you're on the internet a lot. You'll be communicating with friends, family and colleagues using email and/or social media. You might be using the internet to undertake household tasks like shopping or banking or arranging for your central heating to be serviced. You might stream music or a movie, or watch catch-up TV. And of course, if you’re an OU student you'll be using the internet for your studies!
But even in the case of people who don't have any of that technology – who don't own a smartphone or a tablet, and who, in the Global North, are more likely to be poor and old – a lot of what they do will be managed by digital technologies. The bus that runs into town will probably have a sensor on it sending wireless signals to an LED sign on a bus stop saying when it will arrive; traffic lights may be controlled by sensors counting traffic flow; the stock levels in local supermarkets are managed using software; the cash register where shopping is paid for, and the loyalty card that is swiped as part of that transaction, both take data from that sale and send it elsewhere, via the internet. Cities in particular are full of machines gathering digital data about all sorts of things.
We can think of the internet as a way of transmitting all the data that is generated by an activity. Data, according to Rob Kitchin in his book The Data Revolution, "are raw elements that can be abstracted from (given by) phenomena – measured and recorded in various ways. However, in general use, data refer to those elements that are taken: extracted through observations, computations, experiments, and record keeping" (p2). A variety of digital devices now capture lots of different kinds of data – from your supermarket purchases to your health records – and hold it in vast databases, where it can then be put to many uses. Many commentators argue that, while human societies have always created data, digital technologies are now gathering it as a speed and volume that is unprecedented historically.
Some scholars and campaigners, however, are worried that, while we're very familiar with digital screens and do lots of things with them, most of us are much less aware of the data that they gather, who owns that data, where it goes and what gets done with it. They suggest that this is in part because the internet itself – all those connections that send data between computers, the way that data is analysed and used – is invisible. They think the invisibility of the internet is a problem because it makes it harder to understand, or even to think about, what happens to that data.
So how can the internet be pictured - literally?
One approach adopted by some artists in response to this concern is to concentrate on the hardware – the physical supports of the internet – and map the sensors and devices that transmit data, the cables that carry it to servers and the servers where it's stored and processed.
Artist Ingrid Burrington, for example, has produced a guide to the streets of New York that points out all the ways in which the hardware of the internet is evident in an ordinary street. She lists manhole covers, street markings, antennae and buildings that house data centres. Ingrid and Dan Williams did something similar in London in late 2015, for an exhibition of data-based artwork. To Ingrid's list of New York internet infrastructure they added green BT utility cabinets. You can see her work at Seeing Networks and BigBangData
Lots of digital data is also carried wirelessly, and artist/designer, Timo Arnall, developed a project that makes wireless signals visible by turning them into patterns of light. Timo Arnall has also documented a data-centre: that is, the building in which huge servers store data (in this case, the digital communication company, Telefonica).
You can see his work at Elastic Space, where the works Internet Machine and The Immaterials are most relevant for the sort of analysis I am discussing. These are just a couple of examples of artists making the internet visible by visualising its infrastructure.
Making the workers visible
Picturing the technological infrastructure of the internet is an important form of documentation. However it doesn't address the ways in which this infrastructure depends on all sorts of human workers for its construction and maintenance. Other artists have therefore decided to picture the human labour involved in creating the internet's infrastructure, and so too have many campaigning organisations.
Many digital technologies rely on rare metals – tin, copper, titanium, for example – to function. Mining for these metals causes devastating ecological damage, both in the extraction process itself and in how waste from that process is disposed of. Moreover, mining for these minerals in low-income countries is often poorly paid, with little concern for workers' safety and security.
And of course the internet requires all sorts of other labour too: the work of building its hardware (from cables and servers to smartphones and sensors), installing and maintaining that hardware, designing its software (from databases to apps), managing its data flows, not to mention all the things that are done with the internet in everyday code/spaces.
Campaigning organisations concerned about both the human and environmental consequences of this mining have used images to make those costs visible. For example, Friends of the Earth have published this photoessay about the environmental consequences of mining for tin in Indonesia's Bangka islands, or read the journalist David Nield’s introduction to the environmental costs of smartphone production.
Photographs of the people and objects that make up the internet show us some of the spaces and places of the internet's infrastructure: the mines where some of its components begin their lives, and the streets where many of them function. They also show us some of the components of the internet: its infrastructure and its workers.
But the internet is made up of one more thing: its data.
Visualising digital data
Many artists and campaigners have also used the data that flows through the internet's cables and servers as material for their work. Artists have converted digital data into images, sculptures and installations, and 2015 and early 2016 saw several exhibitions in Europe that explored the diversity of this work. Academics have also tracked the patterns that different kinds of data make as they travel through the internet.
The image below is just one example of how the data that travels through the internet has its own geographies. This map looks at the online encyclopedia, Wikipedia; specifically it examines the location of the events, places and people mentioned in Wikipedia articles. What it shows is that most of the events, places and people mentioned are located in Western Europe.
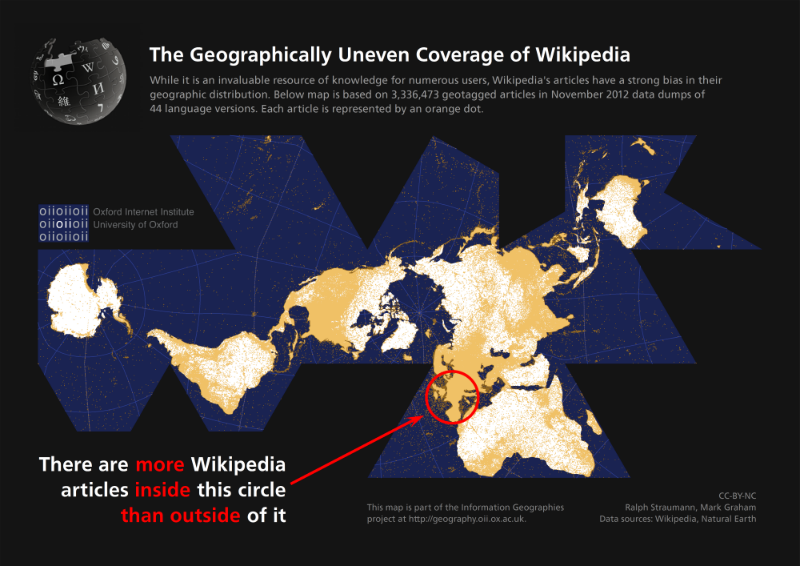
In other work on what places are mentioned in Wikipedia, Mark Graham and his collaborators note that:
“There is a clear and highly uneven geography of information in Wikipedia. Europe and North America are home to 84% of all articles. Anguilla has the fewest number of geotagged articles (four), and indeed most small island nations and city states have less than 100 articles. However, it is not just microstates that are characterized by extremely low levels of wiki representation. Almost all of Africa is poorly represented in the encyclopedia. Remarkably, there are more Wikipedia articles (7,800) written about Antarctica than any country in Africa or South America. Even China, which is home to the world’s biggest population of Internet users and is the fourth largest country on Earth contains fewer than 1% of all geotagged articles. Because of the high visibility of Wikipedia in online information ecosystems, countless decisions are made and countless opinions are formed based on information available in the encyclopedia. It is thus important to point out the digital terra incognita that covers much of the world and reproduces existing representational asymmetries.”
So, what do we see when we think about the internet?
I would suggest that, if we try, we can see infrastructure, digital workers and data., and we can see these in very different formats. Here, you've seen art documentary photography, video art, graphic art and maps – and other artists’ work to make software code visible.
But the most important thing that many of these images show, are the inequalities embedded at the heart of the internet. In both its physical infrastructure, the kind of labour it relies on, and the data it generates, the internet has a highly differentiated geography.
Further reading
Early in 2016, London hosted two exhibitions with lots of work looking at data and the interned: one was called Big Bang Data, and the other was called Electronic Superhighway. You can listen to a podcast that discusses those two shows and more at The Guardian website.
Geography Matters
-
Geography Matters: A Collection
Watch now to access more details of Geography Matters: A CollectionWant to find out more about Geography and Environmental Studies at The Open University?

Level: 1 Introductory
-
The Legacy of Nuclear Power: Part 1
Listen now to access more details of The Legacy of Nuclear Power: Part 1How do local communities respond to the risks and opportunities of nuclear power?

Level: 1 Introductory
-
‘Citizen sensing’ and new forms of environmental monitoring
Read now to access more details of ‘Citizen sensing’ and new forms of environmental monitoringWhat technological challenges are faced by communities seeking to understand environmental change at different geographical scales?
Level: 1 Introductory
-
Protecting Landscapes and Creating the Right Tools for the Job
Listen now to access more details of Protecting Landscapes and Creating the Right Tools for the JobHow do national parks manage the demands of different users, whilst still conserving natural beauty?
Level: 1 Introductory
Rate and Review
Rate this article
Review this article
Log into OpenLearn to leave reviews and join in the conversation.
Article reviews