Nature & Environment
Energy in buildings
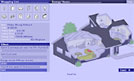
...solar gains from solar energy penetrating the windows. In a really low-energy house design, free heat and solar gains may provide more useful heating than the heating system itself. Obviously in order to achieve a low overall space heating demand it is necessary to reduce the heat losses. Figure 4 shows a small house and illustrates the ways in which heat flows ......