
Society, Politics & Law
Looking at population data
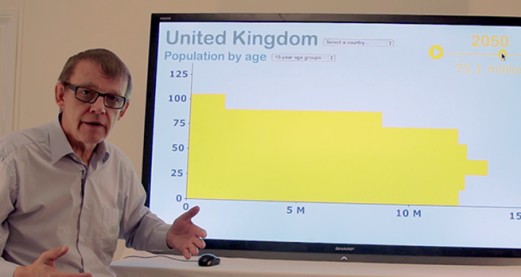
...becoming 15 year olds, 20 year olds becoming 35 years olds, and so on. However, with different width age bands, (0-14, 15-64, 65+) and data collected every 10 years, it can be hard to imagine how the counts in the 0-14 age band translate into changes in the counts given for the 15-64 age band over time, particularly if we don’t know how the population is initially...


