

1.5 How RE changes over time
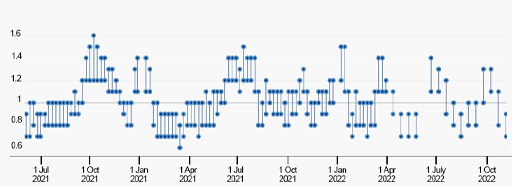
We have already noted that RE changes over time due to variable susceptibility, public health measures and vaccination. The value at any one time is important, since if RE >1 an epidemic is growing, whereas when RE <1 it is shrinking. Figure 4 shows the estimated value of RE at different time points between July 2020 and October 2022. The values are given as ranges, and values vary above or below the critical value, RE = 1.
It is important to understand that the values shown in Figure 4 are not the numbers of people affected by COVID-19, but they reflect whether numbers affected are increasing or decreasing. It is possible to have very few people affected but a high value of RE, or many people affected and a low value of RE. This type of data was fundamental for informing public health policies in the early phases of the pandemic, before vaccines were available. If RE values were >1, then the numbers that would be infected over the following weeks or months could be projected. In order to prevent the huge numbers overwhelming medical services, public health measures were introduced to reduce contact rates and bring RE <1.
As one example, look at the RE values in the month before January 2021 (Figure 4). The sudden rise in RE at this time corresponds with the government decision to end lockdown restrictions on December 2nd 2020. Once the effect of this policy became evident, the lockdown had to be reinstated on 21st December in London and Southeast England and 26th December in other parts of the UK (Institute for Government analysis, 2021). With public health measures back in force, the RE value fell below 1.
Once vaccines became available the proportion of susceptible individuals was reduced and vaccination could be relied on to keep infection rates under control. Consequently, during 2021, there was a progressive shift from a reliance on public health measures (to reduce contacts) to the use of vaccines (to reduce susceptibles).
[Note that when RE values are stated in relation to particular time-points or over a period of time they are often referred to as RTvalues also called the net reproduction number. In many publications values of RT or RE are just given as R-values.]