

2.1 Laboratory investigation
The aim of this investigation is to detect how antibodies are induced following a primary and secondary injection of SARS-CoV2 spike protein. For a phase-1 vaccine trial, assays like this would be carried out on samples from 100s or 1000s of healthy volunteers.
Activity 2 Quantitation of antibodies induced by vaccination
For this ELISA, you are only supplied with plates sensitised with spike protein; since the vaccination is against spike protein, there is no point in trying to detect antibodies against other viral components. IgG antibodies are most important for conferring immunity, so we ask you to quantitate IgG S-antibodies, using the ELISA protocol that you developed in week 4.
You will need to use at least two ELISA plates, one for each of the subjects. Set out each ELISA plate with samples from one of subjects, arranged in the order they were taken – day 0, 7, 14, 21, 56, 70, 200. You should also include the standard as a positive control. The day 0 sample will act as negative control in this assay, since the subjects were pre-selected to have no S-antibodies at the start of the trial. The results from each of your subjects should look something like Figure 4. Note that the subject shown in Figure 4 is different from the ones that you are measuring, and that the chromogen OPD has been used, which gives a red end-product.
I don’t see this in OSL so haven’t looked at it, I assume it’s very similar to the other one but happy to look at it if someone sends me the link
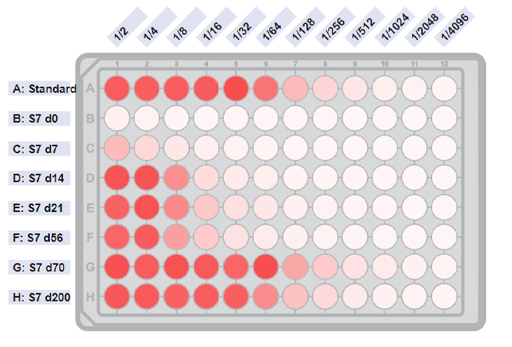
Notice how IgG antibody titres rise in the 21 days after the first injection at day 0 and then rise sharply following the second injection at day 56. The levels only decline slightly over the following 6 months (d200). The two samples that you have investigated have a very similar time-course profile to this example although the peak titre at day 70 does vary between individuals.
-
What was the titre of IgG antibodies to spike protein at day 70 in the two subjects you measured?
-
The titres determined at day 70 were: S1 = 800 and S2 = 1600. The titres you measured should lie within one well of these values. For example, you might have estimated S1 titre as 512 or 1024, if you did a doubling dilution series.
If time allows, you could also look at what happens to IgM or IgA titres in the two subjects. We expect IgM to appear slightly before IgG following the primary injection and decline quite quickly. The titre of IgA is likely to follow quite closely the appearance of IgG, but at a lower titre, because the vaccination was given by intramuscular injection, which tends to induce IgG, rather than IgA.