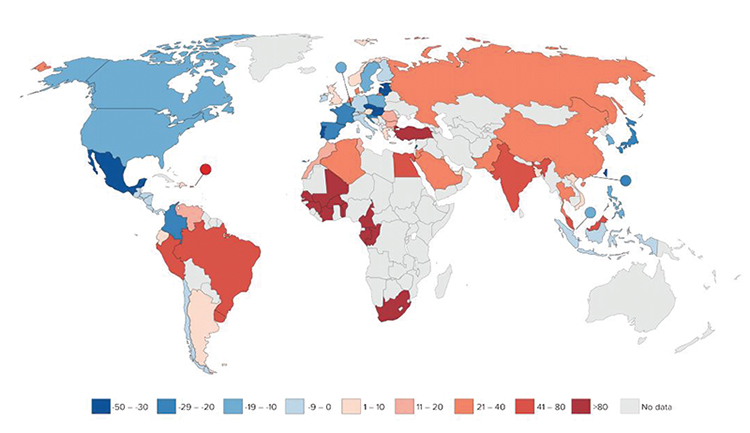
Figure 4 Percentage change in antibiotic consumption per capita 2000–2010. Percentage decrease is indicated in blue while percentage increase is indicated in red. Lower percentage changes are indicated by lighter colours.

Personalise your OpenLearn profile, save your favourite content and get recognition for your learning

Start this free course now. Just create an account and sign in. Enrol and complete the course for a free statement of participation or digital badge if available.