

1.3 The effective reproduction number RE
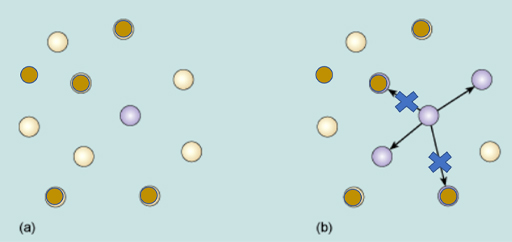
Since most populations will have some level of immunity to an infectious disease, the rate of spread will be less than indicated by the R0 value. The measure of how a disease spreads in real situations is given by another dimensionless variable RE – the effective reproduction number (Figure 3), which is often just called the R-value.
Notice that RE will never be greater than R0 and will usually be less than R0 because of the level of resistance or immunity in the population.
Another point is that RE can tell us something about whether an infection will develop into an epidemic or just die out. If RE is >1 then the number of infections will gradually increase over time. Exactly how quickly an epidemic will develop depends partly on the value of RE, and partly on how long it takes before each infected person becomes infectious themselves, ie the time-course of infection.
Conversely if RE <1 then the infection is self-limiting, because the number of infected people gradually decreases over time.